Belizean vs Immigrants from Poland Cognitive Disability
COMPARE
Belizean
Immigrants from Poland
Cognitive Disability
Cognitive Disability Comparison
Belizeans
Immigrants from Poland
18.0%
COGNITIVE DISABILITY
0.4/ 100
METRIC RATING
266th/ 347
METRIC RANK
16.1%
COGNITIVE DISABILITY
100.0/ 100
METRIC RATING
8th/ 347
METRIC RANK
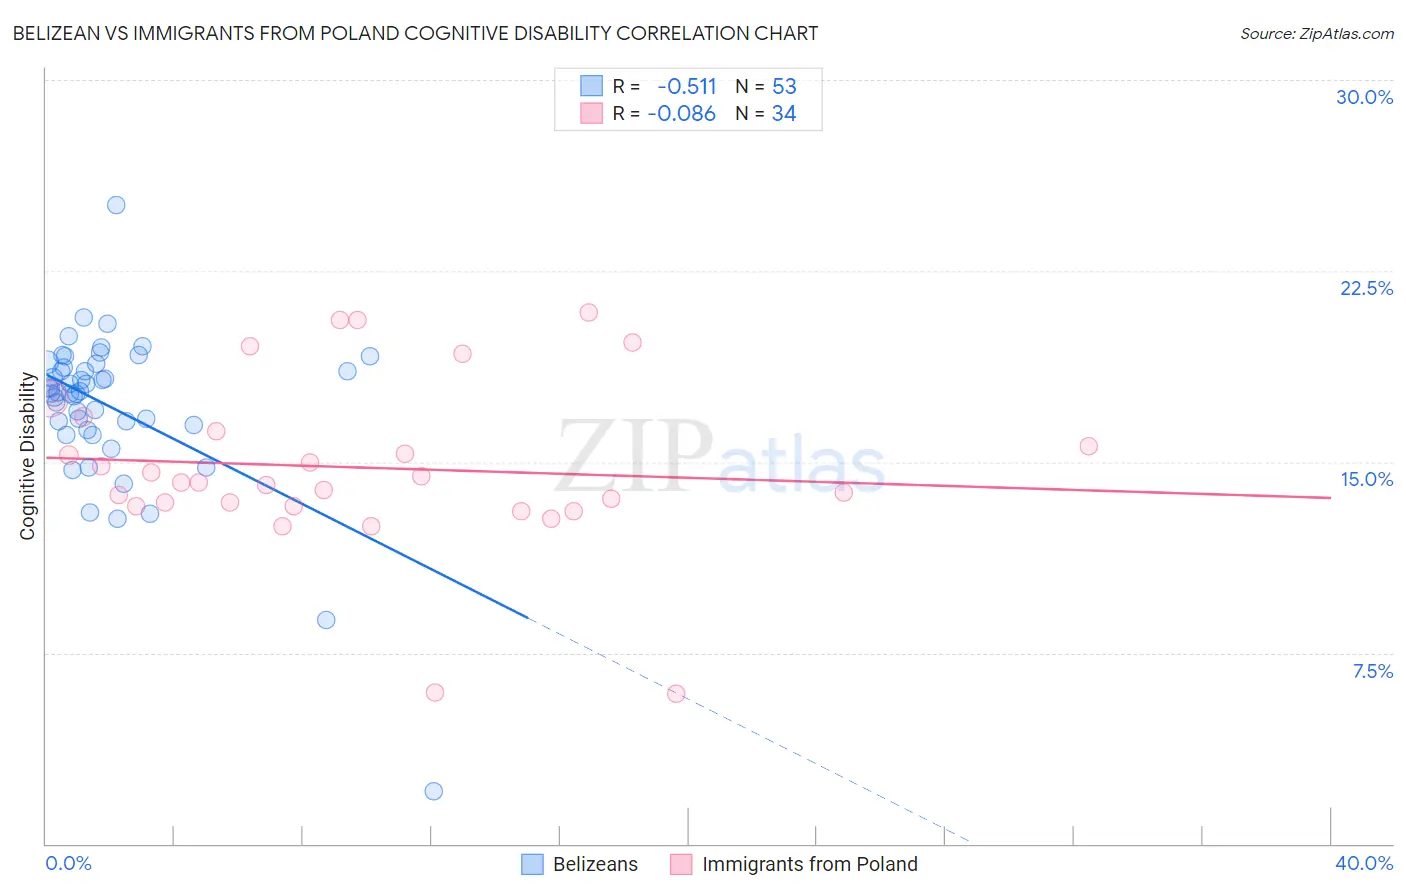
Belizean vs Immigrants from Poland Cognitive Disability Correlation Chart
The statistical analysis conducted on geographies consisting of 144,188,092 people shows a substantial negative correlation between the proportion of Belizeans and percentage of population with cognitive disability in the United States with a correlation coefficient (R) of -0.511 and weighted average of 18.0%. Similarly, the statistical analysis conducted on geographies consisting of 304,838,376 people shows a slight negative correlation between the proportion of Immigrants from Poland and percentage of population with cognitive disability in the United States with a correlation coefficient (R) of -0.086 and weighted average of 16.1%, a difference of 11.3%.
Cognitive Disability Correlation Summary
| Measurement | Belizean | Immigrants from Poland |
| Minimum | 2.1% | 5.9% |
| Maximum | 25.1% | 20.9% |
| Range | 23.0% | 15.0% |
| Mean | 17.1% | 14.8% |
| Median | 17.7% | 14.2% |
| Interquartile 25% (IQ1) | 16.3% | 13.3% |
| Interquartile 75% (IQ3) | 18.8% | 16.2% |
| Interquartile Range (IQR) | 2.5% | 2.9% |
| Standard Deviation (Sample) | 3.2% | 3.4% |
| Standard Deviation (Population) | 3.2% | 3.3% |
Similar Demographics by Cognitive Disability
Demographics Similar to Belizeans by Cognitive Disability
In terms of cognitive disability, the demographic groups most similar to Belizeans are Spanish American (18.0%, a difference of 0.0%), Menominee (18.0%, a difference of 0.030%), Nepalese (18.0%, a difference of 0.060%), Cherokee (18.0%, a difference of 0.070%), and Immigrants from Barbados (17.9%, a difference of 0.090%).
| Demographics | Rating | Rank | Cognitive Disability |
| Ethiopians | 0.5 /100 | #259 | Tragic 17.9% |
| Immigrants | Belize | 0.5 /100 | #260 | Tragic 17.9% |
| Guamanians/Chamorros | 0.5 /100 | #261 | Tragic 17.9% |
| Sierra Leoneans | 0.4 /100 | #262 | Tragic 17.9% |
| Immigrants | Barbados | 0.4 /100 | #263 | Tragic 17.9% |
| Menominee | 0.4 /100 | #264 | Tragic 18.0% |
| Spanish Americans | 0.4 /100 | #265 | Tragic 18.0% |
| Belizeans | 0.4 /100 | #266 | Tragic 18.0% |
| Nepalese | 0.3 /100 | #267 | Tragic 18.0% |
| Cherokee | 0.3 /100 | #268 | Tragic 18.0% |
| Hondurans | 0.3 /100 | #269 | Tragic 18.0% |
| Immigrants | Bahamas | 0.3 /100 | #270 | Tragic 18.0% |
| Potawatomi | 0.2 /100 | #271 | Tragic 18.0% |
| Immigrants | Honduras | 0.2 /100 | #272 | Tragic 18.0% |
| Immigrants | Nepal | 0.2 /100 | #273 | Tragic 18.0% |
Demographics Similar to Immigrants from Poland by Cognitive Disability
In terms of cognitive disability, the demographic groups most similar to Immigrants from Poland are Immigrants from Ireland (16.1%, a difference of 0.020%), Thai (16.1%, a difference of 0.13%), Assyrian/Chaldean/Syriac (16.2%, a difference of 0.32%), Immigrants from Scotland (16.2%, a difference of 0.36%), and Immigrants from Czechoslovakia (16.2%, a difference of 0.45%).
| Demographics | Rating | Rank | Cognitive Disability |
| Immigrants | Taiwan | 100.0 /100 | #1 | Exceptional 15.7% |
| Immigrants | India | 100.0 /100 | #2 | Exceptional 15.9% |
| Chinese | 100.0 /100 | #3 | Exceptional 15.9% |
| Immigrants | Lithuania | 100.0 /100 | #4 | Exceptional 16.0% |
| Immigrants | Hong Kong | 100.0 /100 | #5 | Exceptional 16.0% |
| Thais | 100.0 /100 | #6 | Exceptional 16.1% |
| Immigrants | Ireland | 100.0 /100 | #7 | Exceptional 16.1% |
| Immigrants | Poland | 100.0 /100 | #8 | Exceptional 16.1% |
| Assyrians/Chaldeans/Syriacs | 100.0 /100 | #9 | Exceptional 16.2% |
| Immigrants | Scotland | 100.0 /100 | #10 | Exceptional 16.2% |
| Immigrants | Czechoslovakia | 100.0 /100 | #11 | Exceptional 16.2% |
| Maltese | 100.0 /100 | #12 | Exceptional 16.2% |
| Lithuanians | 100.0 /100 | #13 | Exceptional 16.3% |
| Immigrants | Austria | 100.0 /100 | #14 | Exceptional 16.3% |
| Immigrants | Greece | 100.0 /100 | #15 | Exceptional 16.3% |