Immigrants from Congo vs Immigrants from Honduras 6th Grade
COMPARE
Immigrants from Congo
Immigrants from Honduras
6th Grade
6th Grade Comparison
Immigrants from Congo
Immigrants from Honduras
96.5%
6TH GRADE
0.6/ 100
METRIC RATING
255th/ 347
METRIC RANK
94.8%
6TH GRADE
0.0/ 100
METRIC RATING
332nd/ 347
METRIC RANK
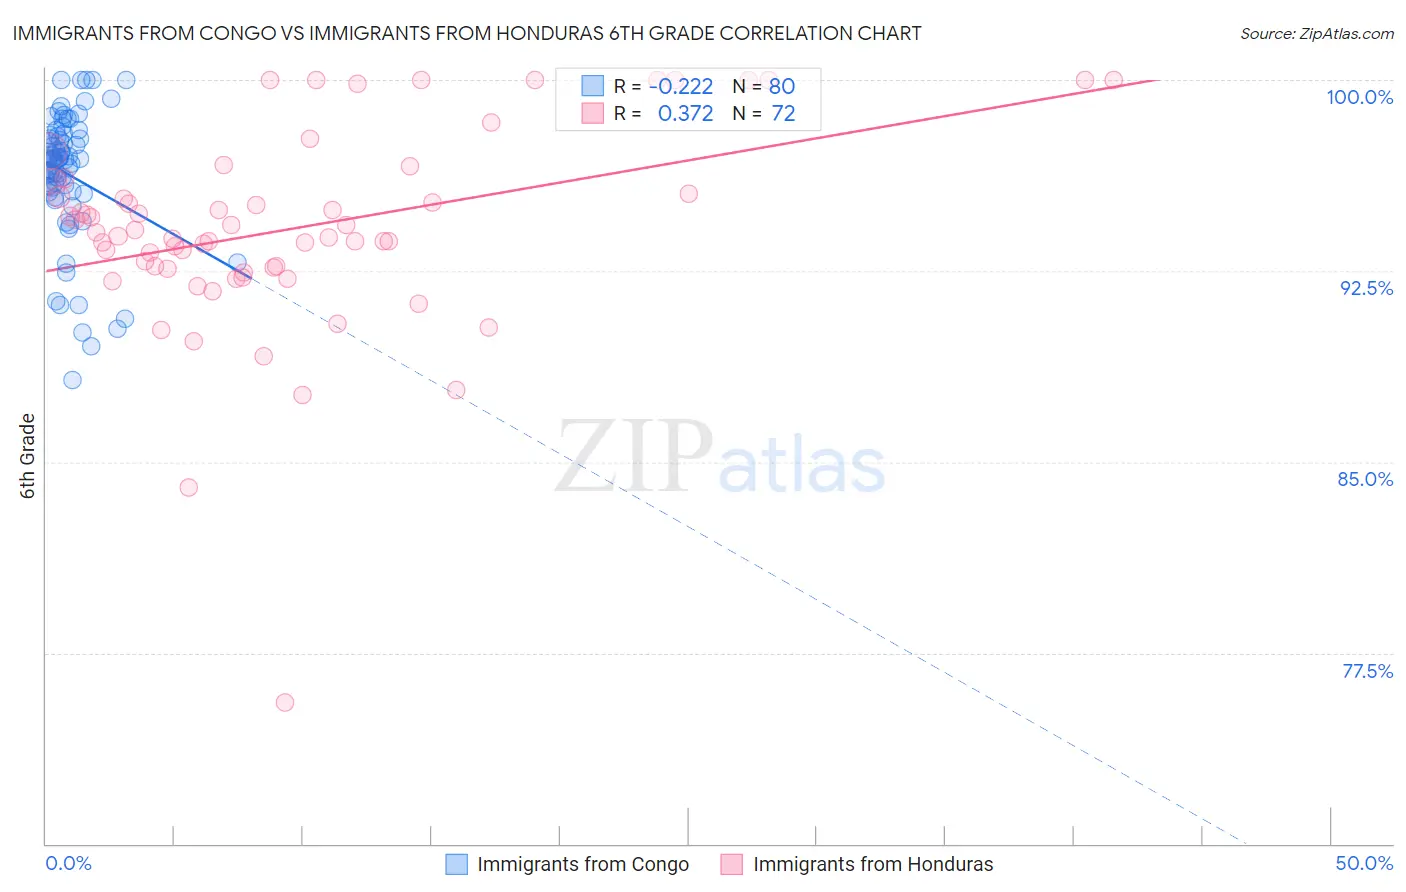
Immigrants from Congo vs Immigrants from Honduras 6th Grade Correlation Chart
The statistical analysis conducted on geographies consisting of 92,124,753 people shows a weak negative correlation between the proportion of Immigrants from Congo and percentage of population with at least 6th grade education in the United States with a correlation coefficient (R) of -0.222 and weighted average of 96.5%. Similarly, the statistical analysis conducted on geographies consisting of 322,637,445 people shows a mild positive correlation between the proportion of Immigrants from Honduras and percentage of population with at least 6th grade education in the United States with a correlation coefficient (R) of 0.372 and weighted average of 94.8%, a difference of 1.8%.
6th Grade Correlation Summary
| Measurement | Immigrants from Congo | Immigrants from Honduras |
| Minimum | 88.2% | 75.6% |
| Maximum | 100.0% | 100.0% |
| Range | 11.8% | 24.4% |
| Mean | 96.3% | 94.2% |
| Median | 96.9% | 93.9% |
| Interquartile 25% (IQ1) | 95.6% | 92.6% |
| Interquartile 75% (IQ3) | 97.8% | 95.8% |
| Interquartile Range (IQR) | 2.2% | 3.2% |
| Standard Deviation (Sample) | 2.6% | 4.0% |
| Standard Deviation (Population) | 2.6% | 3.9% |
Similar Demographics by 6th Grade
Demographics Similar to Immigrants from Congo by 6th Grade
In terms of 6th grade, the demographic groups most similar to Immigrants from Congo are Immigrants from Ethiopia (96.5%, a difference of 0.0%), Immigrants from Uruguay (96.5%, a difference of 0.010%), Jamaican (96.5%, a difference of 0.010%), U.S. Virgin Islander (96.5%, a difference of 0.010%), and Immigrants from Senegal (96.5%, a difference of 0.020%).
| Demographics | Rating | Rank | 6th Grade |
| Tohono O'odham | 1.0 /100 | #248 | Tragic 96.5% |
| Colombians | 0.9 /100 | #249 | Tragic 96.5% |
| Immigrants | Middle Africa | 0.8 /100 | #250 | Tragic 96.5% |
| Immigrants | Senegal | 0.7 /100 | #251 | Tragic 96.5% |
| Immigrants | Uruguay | 0.6 /100 | #252 | Tragic 96.5% |
| Jamaicans | 0.6 /100 | #253 | Tragic 96.5% |
| Immigrants | Ethiopia | 0.6 /100 | #254 | Tragic 96.5% |
| Immigrants | Congo | 0.6 /100 | #255 | Tragic 96.5% |
| U.S. Virgin Islanders | 0.5 /100 | #256 | Tragic 96.5% |
| Taiwanese | 0.5 /100 | #257 | Tragic 96.5% |
| Immigrants | China | 0.4 /100 | #258 | Tragic 96.4% |
| South Americans | 0.4 /100 | #259 | Tragic 96.4% |
| Peruvians | 0.4 /100 | #260 | Tragic 96.4% |
| Immigrants | Sierra Leone | 0.4 /100 | #261 | Tragic 96.4% |
| Immigrants | Nigeria | 0.3 /100 | #262 | Tragic 96.4% |
Demographics Similar to Immigrants from Honduras by 6th Grade
In terms of 6th grade, the demographic groups most similar to Immigrants from Honduras are Immigrants from Latin America (94.7%, a difference of 0.080%), Immigrants from Armenia (94.9%, a difference of 0.10%), Immigrants from the Azores (94.7%, a difference of 0.10%), Nepalese (94.9%, a difference of 0.11%), and Mexican (94.6%, a difference of 0.12%).
| Demographics | Rating | Rank | 6th Grade |
| Immigrants | Nicaragua | 0.0 /100 | #325 | Tragic 95.1% |
| Hispanics or Latinos | 0.0 /100 | #326 | Tragic 95.0% |
| Mexican American Indians | 0.0 /100 | #327 | Tragic 95.0% |
| Hondurans | 0.0 /100 | #328 | Tragic 95.0% |
| Dominicans | 0.0 /100 | #329 | Tragic 94.9% |
| Nepalese | 0.0 /100 | #330 | Tragic 94.9% |
| Immigrants | Armenia | 0.0 /100 | #331 | Tragic 94.9% |
| Immigrants | Honduras | 0.0 /100 | #332 | Tragic 94.8% |
| Immigrants | Latin America | 0.0 /100 | #333 | Tragic 94.7% |
| Immigrants | Azores | 0.0 /100 | #334 | Tragic 94.7% |
| Mexicans | 0.0 /100 | #335 | Tragic 94.6% |
| Immigrants | Dominican Republic | 0.0 /100 | #336 | Tragic 94.6% |
| Central Americans | 0.0 /100 | #337 | Tragic 94.5% |
| Immigrants | Cabo Verde | 0.0 /100 | #338 | Tragic 94.4% |
| Yakama | 0.0 /100 | #339 | Tragic 94.3% |