Barbadian vs Guamanian/Chamorro 8th Grade
COMPARE
Barbadian
Guamanian/Chamorro
8th Grade
8th Grade Comparison
Barbadians
Guamanians/Chamorros
94.6%
8TH GRADE
0.1/ 100
METRIC RATING
280th/ 347
METRIC RANK
95.6%
8TH GRADE
26.6/ 100
METRIC RATING
194th/ 347
METRIC RANK
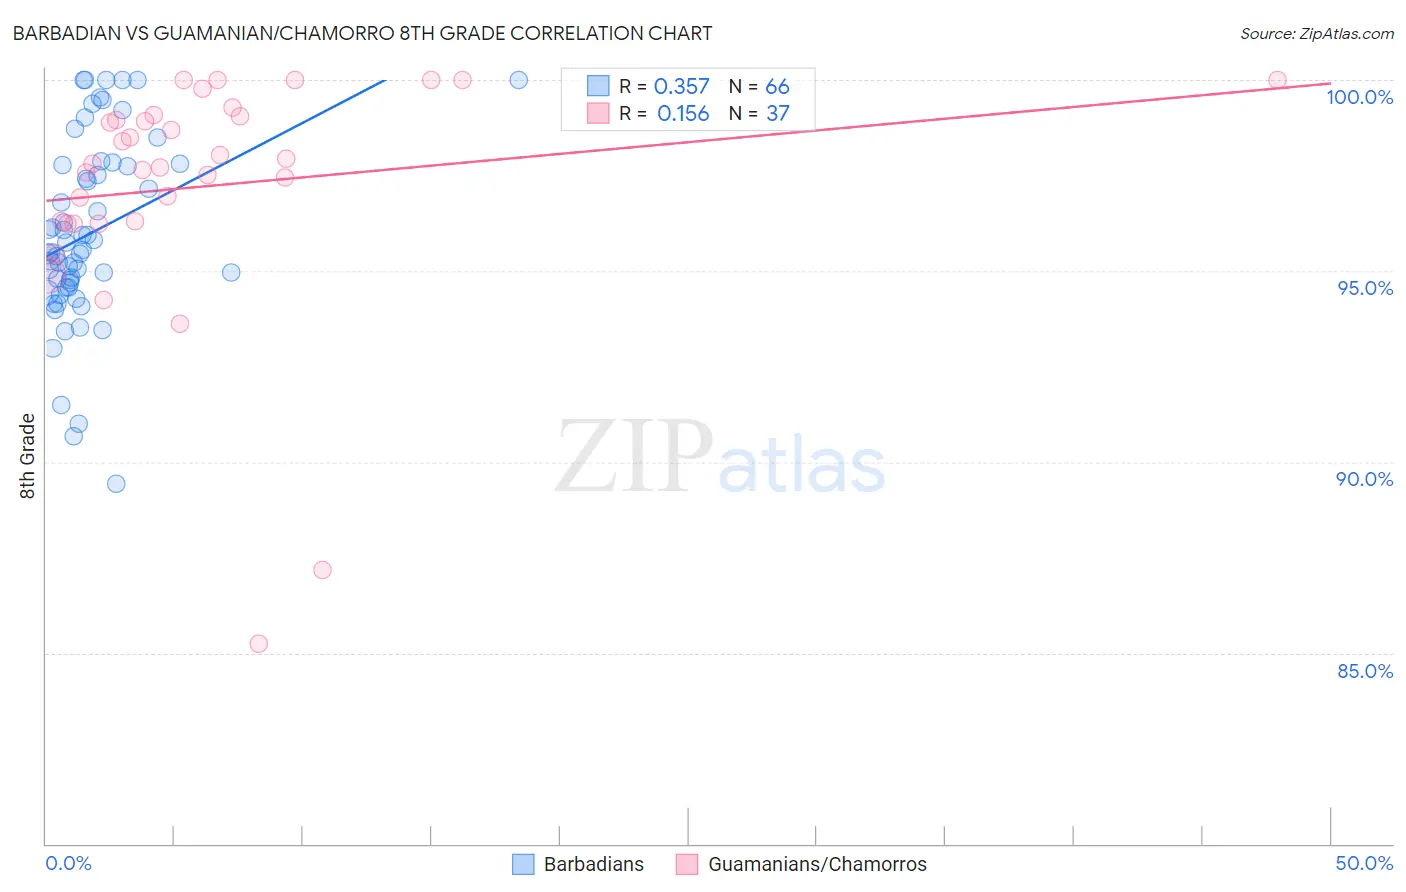
Barbadian vs Guamanian/Chamorro 8th Grade Correlation Chart
The statistical analysis conducted on geographies consisting of 141,299,217 people shows a mild positive correlation between the proportion of Barbadians and percentage of population with at least 8th grade education in the United States with a correlation coefficient (R) of 0.357 and weighted average of 94.6%. Similarly, the statistical analysis conducted on geographies consisting of 221,965,618 people shows a poor positive correlation between the proportion of Guamanians/Chamorros and percentage of population with at least 8th grade education in the United States with a correlation coefficient (R) of 0.156 and weighted average of 95.6%, a difference of 0.99%.
8th Grade Correlation Summary
| Measurement | Barbadian | Guamanian/Chamorro |
| Minimum | 89.4% | 85.2% |
| Maximum | 100.0% | 100.0% |
| Range | 10.6% | 14.8% |
| Mean | 96.0% | 97.2% |
| Median | 95.5% | 97.8% |
| Interquartile 25% (IQ1) | 94.6% | 96.3% |
| Interquartile 75% (IQ3) | 97.8% | 99.1% |
| Interquartile Range (IQR) | 3.2% | 2.8% |
| Standard Deviation (Sample) | 2.4% | 3.2% |
| Standard Deviation (Population) | 2.4% | 3.1% |
Similar Demographics by 8th Grade
Demographics Similar to Barbadians by 8th Grade
In terms of 8th grade, the demographic groups most similar to Barbadians are Immigrants from Trinidad and Tobago (94.6%, a difference of 0.0%), Immigrants from Bolivia (94.6%, a difference of 0.0%), Armenian (94.7%, a difference of 0.010%), Taiwanese (94.7%, a difference of 0.040%), and Immigrants from Eritrea (94.6%, a difference of 0.040%).
| Demographics | Rating | Rank | 8th Grade |
| Immigrants | Western Africa | 0.2 /100 | #273 | Tragic 94.8% |
| Trinidadians and Tobagonians | 0.2 /100 | #274 | Tragic 94.7% |
| Immigrants | Colombia | 0.2 /100 | #275 | Tragic 94.7% |
| Peruvians | 0.1 /100 | #276 | Tragic 94.7% |
| Taiwanese | 0.1 /100 | #277 | Tragic 94.7% |
| Armenians | 0.1 /100 | #278 | Tragic 94.7% |
| Immigrants | Trinidad and Tobago | 0.1 /100 | #279 | Tragic 94.6% |
| Barbadians | 0.1 /100 | #280 | Tragic 94.6% |
| Immigrants | Bolivia | 0.1 /100 | #281 | Tragic 94.6% |
| Immigrants | Eritrea | 0.1 /100 | #282 | Tragic 94.6% |
| Immigrants | St. Vincent and the Grenadines | 0.1 /100 | #283 | Tragic 94.6% |
| Immigrants | Philippines | 0.1 /100 | #284 | Tragic 94.6% |
| Immigrants | Barbados | 0.0 /100 | #285 | Tragic 94.5% |
| Immigrants | Peru | 0.0 /100 | #286 | Tragic 94.5% |
| Tohono O'odham | 0.0 /100 | #287 | Tragic 94.5% |
Demographics Similar to Guamanians/Chamorros by 8th Grade
In terms of 8th grade, the demographic groups most similar to Guamanians/Chamorros are Panamanian (95.6%, a difference of 0.010%), Immigrants from Zaire (95.6%, a difference of 0.010%), Pima (95.6%, a difference of 0.020%), Assyrian/Chaldean/Syriac (95.6%, a difference of 0.020%), and Sierra Leonean (95.6%, a difference of 0.020%).
| Demographics | Rating | Rank | 8th Grade |
| Sudanese | 33.0 /100 | #187 | Fair 95.6% |
| Liberians | 32.4 /100 | #188 | Fair 95.6% |
| Immigrants | Micronesia | 31.6 /100 | #189 | Fair 95.6% |
| Immigrants | Venezuela | 30.8 /100 | #190 | Fair 95.6% |
| Immigrants | Nepal | 30.2 /100 | #191 | Fair 95.6% |
| Pima | 28.6 /100 | #192 | Fair 95.6% |
| Panamanians | 28.4 /100 | #193 | Fair 95.6% |
| Guamanians/Chamorros | 26.6 /100 | #194 | Fair 95.6% |
| Immigrants | Zaire | 25.2 /100 | #195 | Fair 95.6% |
| Assyrians/Chaldeans/Syriacs | 24.5 /100 | #196 | Fair 95.6% |
| Sierra Leoneans | 24.3 /100 | #197 | Fair 95.6% |
| Paraguayans | 22.6 /100 | #198 | Fair 95.5% |
| Immigrants | Northern Africa | 22.5 /100 | #199 | Fair 95.5% |
| Argentineans | 22.2 /100 | #200 | Fair 95.5% |
| Immigrants | Argentina | 20.6 /100 | #201 | Fair 95.5% |