Barbadian vs Mongolian 5th Grade
COMPARE
Barbadian
Mongolian
5th Grade
5th Grade Comparison
Barbadians
Mongolians
96.6%
5TH GRADE
0.1/ 100
METRIC RATING
282nd/ 347
METRIC RANK
97.3%
5TH GRADE
39.4/ 100
METRIC RATING
182nd/ 347
METRIC RANK
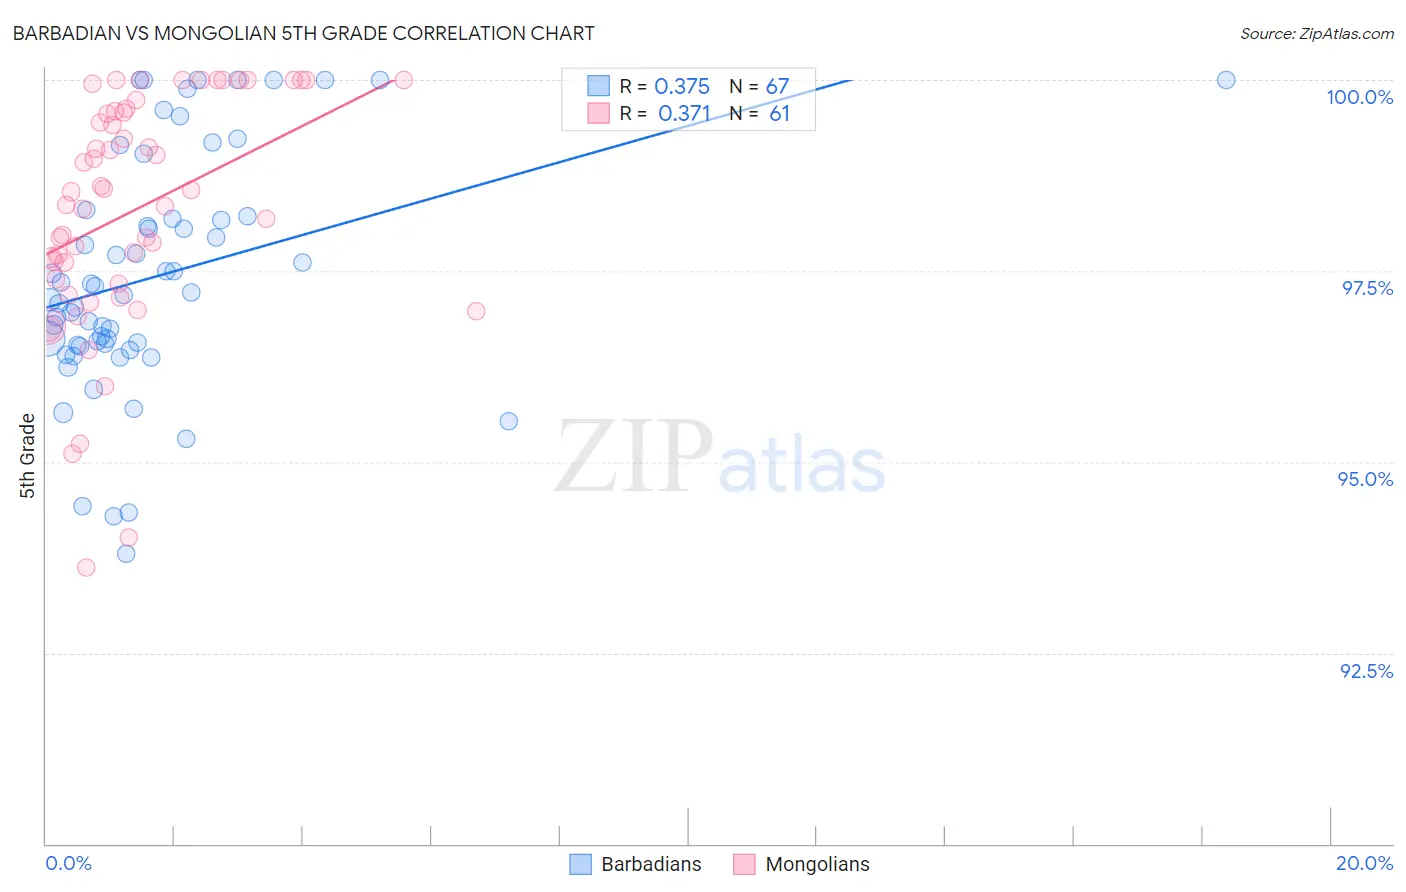
Barbadian vs Mongolian 5th Grade Correlation Chart
The statistical analysis conducted on geographies consisting of 141,304,590 people shows a mild positive correlation between the proportion of Barbadians and percentage of population with at least 5th grade education in the United States with a correlation coefficient (R) of 0.375 and weighted average of 96.6%. Similarly, the statistical analysis conducted on geographies consisting of 140,362,004 people shows a mild positive correlation between the proportion of Mongolians and percentage of population with at least 5th grade education in the United States with a correlation coefficient (R) of 0.371 and weighted average of 97.3%, a difference of 0.70%.
5th Grade Correlation Summary
| Measurement | Barbadian | Mongolian |
| Minimum | 93.8% | 93.6% |
| Maximum | 100.0% | 100.0% |
| Range | 6.2% | 6.4% |
| Mean | 97.4% | 98.3% |
| Median | 97.2% | 98.5% |
| Interquartile 25% (IQ1) | 96.5% | 97.4% |
| Interquartile 75% (IQ3) | 98.2% | 99.6% |
| Interquartile Range (IQR) | 1.7% | 2.2% |
| Standard Deviation (Sample) | 1.5% | 1.5% |
| Standard Deviation (Population) | 1.5% | 1.5% |
Similar Demographics by 5th Grade
Demographics Similar to Barbadians by 5th Grade
In terms of 5th grade, the demographic groups most similar to Barbadians are Immigrants from Western Africa (96.6%, a difference of 0.0%), Houma (96.6%, a difference of 0.0%), Fijian (96.6%, a difference of 0.0%), Immigrants from Philippines (96.6%, a difference of 0.010%), and Immigrants from Trinidad and Tobago (96.6%, a difference of 0.010%).
| Demographics | Rating | Rank | 5th Grade |
| Immigrants | Peru | 0.1 /100 | #275 | Tragic 96.6% |
| Cubans | 0.1 /100 | #276 | Tragic 96.6% |
| Immigrants | Bolivia | 0.1 /100 | #277 | Tragic 96.6% |
| Immigrants | Ghana | 0.1 /100 | #278 | Tragic 96.6% |
| Immigrants | Philippines | 0.1 /100 | #279 | Tragic 96.6% |
| Immigrants | Western Africa | 0.1 /100 | #280 | Tragic 96.6% |
| Houma | 0.1 /100 | #281 | Tragic 96.6% |
| Barbadians | 0.1 /100 | #282 | Tragic 96.6% |
| Fijians | 0.1 /100 | #283 | Tragic 96.6% |
| Immigrants | Trinidad and Tobago | 0.1 /100 | #284 | Tragic 96.6% |
| Immigrants | St. Vincent and the Grenadines | 0.1 /100 | #285 | Tragic 96.6% |
| Immigrants | Thailand | 0.1 /100 | #286 | Tragic 96.6% |
| Immigrants | Afghanistan | 0.1 /100 | #287 | Tragic 96.6% |
| Immigrants | Barbados | 0.0 /100 | #288 | Tragic 96.6% |
| Immigrants | West Indies | 0.0 /100 | #289 | Tragic 96.5% |
Demographics Similar to Mongolians by 5th Grade
In terms of 5th grade, the demographic groups most similar to Mongolians are Immigrants from Kenya (97.3%, a difference of 0.0%), Pakistani (97.3%, a difference of 0.0%), Argentinean (97.3%, a difference of 0.0%), Immigrants from Ukraine (97.3%, a difference of 0.0%), and Immigrants from Venezuela (97.3%, a difference of 0.0%).
| Demographics | Rating | Rank | 5th Grade |
| Immigrants | Micronesia | 48.8 /100 | #175 | Average 97.3% |
| Immigrants | Taiwan | 48.4 /100 | #176 | Average 97.3% |
| Immigrants | Spain | 47.0 /100 | #177 | Average 97.3% |
| Comanche | 42.1 /100 | #178 | Average 97.3% |
| Immigrants | Kenya | 40.3 /100 | #179 | Average 97.3% |
| Pakistanis | 40.2 /100 | #180 | Average 97.3% |
| Argentineans | 39.5 /100 | #181 | Fair 97.3% |
| Mongolians | 39.4 /100 | #182 | Fair 97.3% |
| Immigrants | Ukraine | 38.6 /100 | #183 | Fair 97.3% |
| Immigrants | Venezuela | 38.4 /100 | #184 | Fair 97.3% |
| Dutch West Indians | 36.2 /100 | #185 | Fair 97.3% |
| Immigrants | Argentina | 36.1 /100 | #186 | Fair 97.3% |
| Spanish Americans | 34.7 /100 | #187 | Fair 97.3% |
| Paraguayans | 33.7 /100 | #188 | Fair 97.3% |
| Immigrants | Egypt | 32.9 /100 | #189 | Fair 97.3% |