Barbadian vs Immigrants from South Eastern Asia Associate's Degree
COMPARE
Barbadian
Immigrants from South Eastern Asia
Associate's Degree
Associate's Degree Comparison
Barbadians
Immigrants from South Eastern Asia
43.9%
ASSOCIATE'S DEGREE
5.8/ 100
METRIC RATING
222nd/ 347
METRIC RANK
45.2%
ASSOCIATE'S DEGREE
20.2/ 100
METRIC RATING
203rd/ 347
METRIC RANK
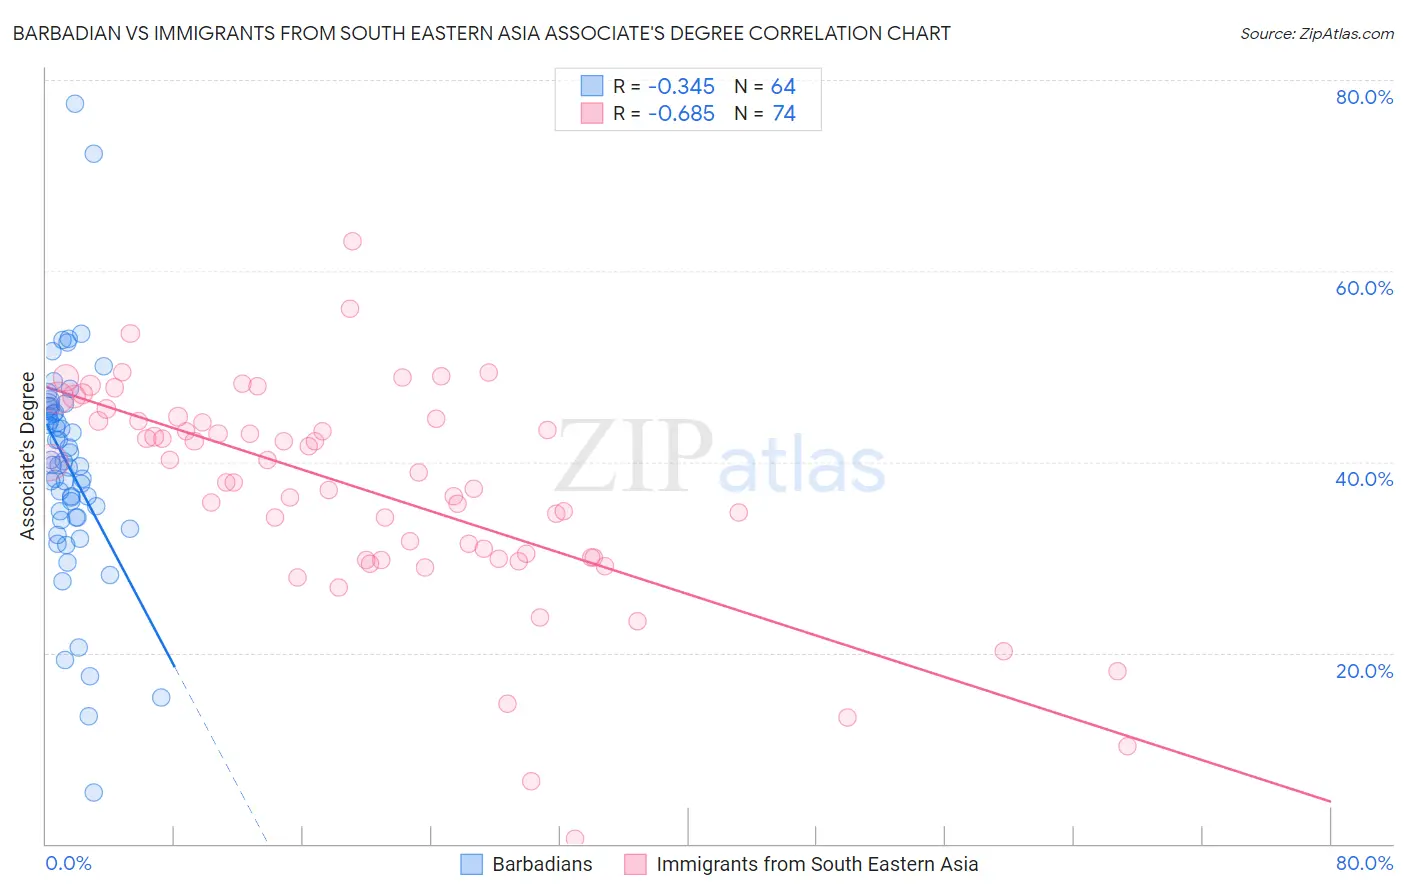
Barbadian vs Immigrants from South Eastern Asia Associate's Degree Correlation Chart
The statistical analysis conducted on geographies consisting of 141,300,746 people shows a mild negative correlation between the proportion of Barbadians and percentage of population with at least associate's degree education in the United States with a correlation coefficient (R) of -0.345 and weighted average of 43.9%. Similarly, the statistical analysis conducted on geographies consisting of 512,661,468 people shows a significant negative correlation between the proportion of Immigrants from South Eastern Asia and percentage of population with at least associate's degree education in the United States with a correlation coefficient (R) of -0.685 and weighted average of 45.2%, a difference of 2.8%.
Associate's Degree Correlation Summary
| Measurement | Barbadian | Immigrants from South Eastern Asia |
| Minimum | 5.4% | 0.50% |
| Maximum | 77.4% | 63.1% |
| Range | 72.1% | 62.6% |
| Mean | 39.4% | 36.9% |
| Median | 39.7% | 38.4% |
| Interquartile 25% (IQ1) | 34.2% | 29.9% |
| Interquartile 75% (IQ3) | 45.4% | 44.3% |
| Interquartile Range (IQR) | 11.2% | 14.4% |
| Standard Deviation (Sample) | 11.7% | 11.4% |
| Standard Deviation (Population) | 11.6% | 11.3% |
Demographics Similar to Barbadians and Immigrants from South Eastern Asia by Associate's Degree
In terms of associate's degree, the demographic groups most similar to Barbadians are Immigrants from Western Africa (44.1%, a difference of 0.27%), Portuguese (44.1%, a difference of 0.47%), White/Caucasian (44.2%, a difference of 0.54%), Spanish (44.4%, a difference of 1.0%), and Immigrants (44.5%, a difference of 1.3%). Similarly, the demographic groups most similar to Immigrants from South Eastern Asia are Spaniard (45.2%, a difference of 0.020%), Nigerian (45.1%, a difference of 0.14%), Immigrants from Thailand (45.1%, a difference of 0.16%), German Russian (45.1%, a difference of 0.17%), and Panamanian (45.1%, a difference of 0.23%).
| Demographics | Rating | Rank | Associate's Degree |
| Spaniards | 20.4 /100 | #202 | Fair 45.2% |
| Immigrants | South Eastern Asia | 20.2 /100 | #203 | Fair 45.2% |
| Nigerians | 19.1 /100 | #204 | Poor 45.1% |
| Immigrants | Thailand | 18.9 /100 | #205 | Poor 45.1% |
| German Russians | 18.9 /100 | #206 | Poor 45.1% |
| Panamanians | 18.4 /100 | #207 | Poor 45.1% |
| Dutch | 17.6 /100 | #208 | Poor 45.0% |
| Immigrants | Costa Rica | 16.7 /100 | #209 | Poor 45.0% |
| Immigrants | Philippines | 16.7 /100 | #210 | Poor 45.0% |
| Immigrants | Zaire | 16.6 /100 | #211 | Poor 45.0% |
| French Canadians | 15.0 /100 | #212 | Poor 44.9% |
| Immigrants | Ghana | 14.2 /100 | #213 | Poor 44.8% |
| Immigrants | Middle Africa | 12.7 /100 | #214 | Poor 44.7% |
| Immigrants | Panama | 12.4 /100 | #215 | Poor 44.7% |
| Immigrants | Nigeria | 11.4 /100 | #216 | Poor 44.6% |
| Immigrants | Immigrants | 10.5 /100 | #217 | Poor 44.5% |
| Spanish | 9.4 /100 | #218 | Tragic 44.4% |
| Whites/Caucasians | 7.5 /100 | #219 | Tragic 44.2% |
| Portuguese | 7.2 /100 | #220 | Tragic 44.1% |
| Immigrants | Western Africa | 6.6 /100 | #221 | Tragic 44.1% |
| Barbadians | 5.8 /100 | #222 | Tragic 43.9% |