Dominican vs Immigrants from Albania 3rd Grade
COMPARE
Dominican
Immigrants from Albania
3rd Grade
3rd Grade Comparison
Dominicans
Immigrants from Albania
96.4%
3RD GRADE
0.0/ 100
METRIC RATING
324th/ 347
METRIC RANK
97.7%
3RD GRADE
22.6/ 100
METRIC RATING
200th/ 347
METRIC RANK
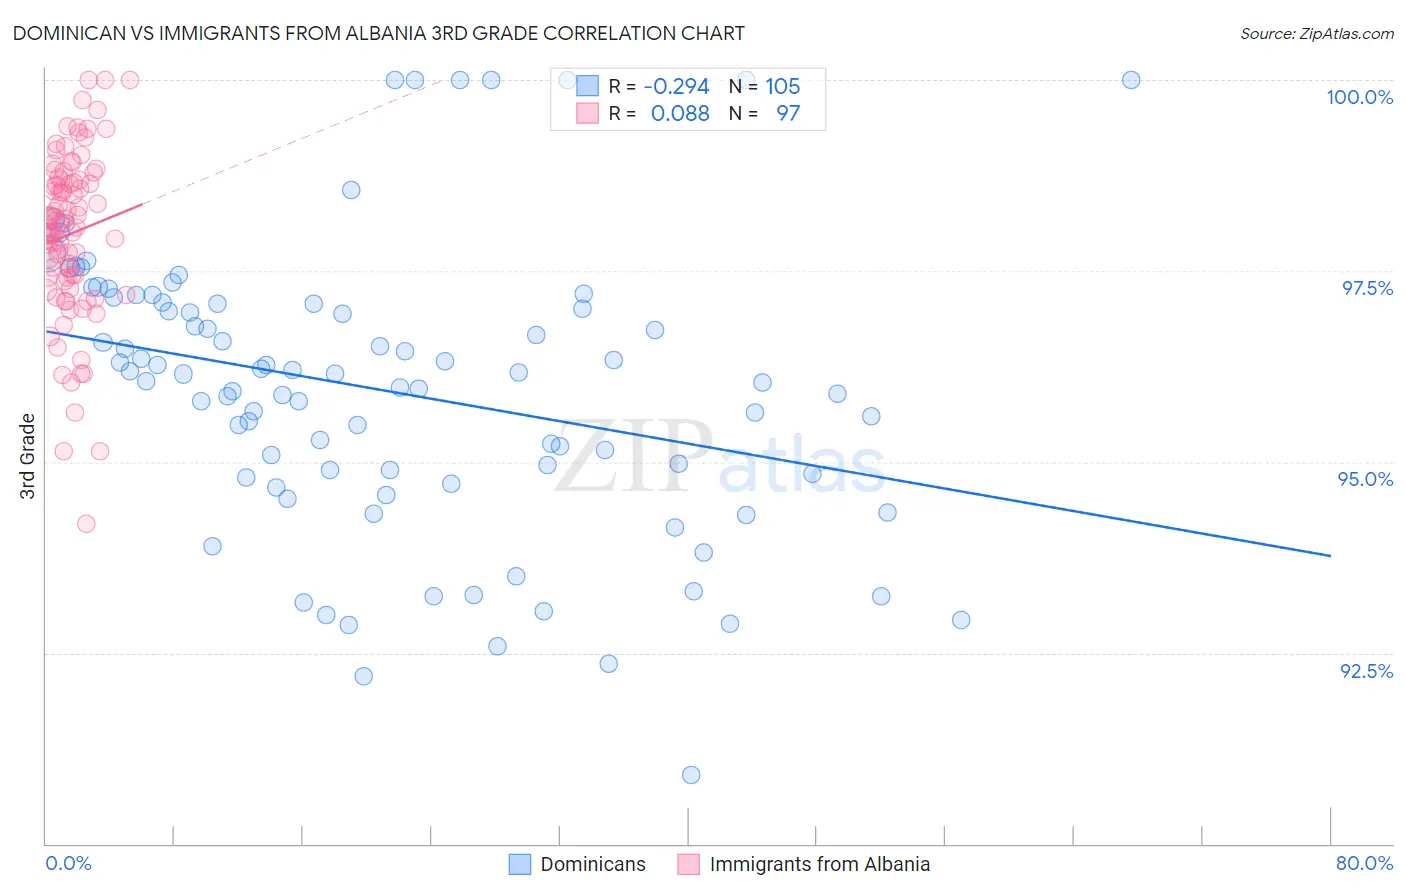
Dominican vs Immigrants from Albania 3rd Grade Correlation Chart
The statistical analysis conducted on geographies consisting of 355,142,603 people shows a weak negative correlation between the proportion of Dominicans and percentage of population with at least 3rd grade education in the United States with a correlation coefficient (R) of -0.294 and weighted average of 96.4%. Similarly, the statistical analysis conducted on geographies consisting of 119,265,453 people shows a slight positive correlation between the proportion of Immigrants from Albania and percentage of population with at least 3rd grade education in the United States with a correlation coefficient (R) of 0.088 and weighted average of 97.7%, a difference of 1.3%.
3rd Grade Correlation Summary
| Measurement | Dominican | Immigrants from Albania |
| Minimum | 90.9% | 94.2% |
| Maximum | 100.0% | 100.0% |
| Range | 9.1% | 5.8% |
| Mean | 95.9% | 98.0% |
| Median | 96.1% | 98.1% |
| Interquartile 25% (IQ1) | 94.8% | 97.4% |
| Interquartile 75% (IQ3) | 97.1% | 98.7% |
| Interquartile Range (IQR) | 2.3% | 1.3% |
| Standard Deviation (Sample) | 1.9% | 1.1% |
| Standard Deviation (Population) | 1.9% | 1.1% |
Similar Demographics by 3rd Grade
Demographics Similar to Dominicans by 3rd Grade
In terms of 3rd grade, the demographic groups most similar to Dominicans are Mexican American Indian (96.4%, a difference of 0.010%), Immigrants from Vietnam (96.4%, a difference of 0.050%), Japanese (96.4%, a difference of 0.060%), Bangladeshi (96.3%, a difference of 0.060%), and Honduran (96.5%, a difference of 0.080%).
| Demographics | Rating | Rank | 3rd Grade |
| Immigrants | Bangladesh | 0.0 /100 | #317 | Tragic 96.6% |
| Hispanics or Latinos | 0.0 /100 | #318 | Tragic 96.5% |
| Vietnamese | 0.0 /100 | #319 | Tragic 96.5% |
| Immigrants | Nicaragua | 0.0 /100 | #320 | Tragic 96.5% |
| Indonesians | 0.0 /100 | #321 | Tragic 96.5% |
| Immigrants | Belize | 0.0 /100 | #322 | Tragic 96.5% |
| Hondurans | 0.0 /100 | #323 | Tragic 96.5% |
| Dominicans | 0.0 /100 | #324 | Tragic 96.4% |
| Mexican American Indians | 0.0 /100 | #325 | Tragic 96.4% |
| Immigrants | Vietnam | 0.0 /100 | #326 | Tragic 96.4% |
| Japanese | 0.0 /100 | #327 | Tragic 96.4% |
| Bangladeshis | 0.0 /100 | #328 | Tragic 96.3% |
| Immigrants | Honduras | 0.0 /100 | #329 | Tragic 96.3% |
| Immigrants | Armenia | 0.0 /100 | #330 | Tragic 96.3% |
| Immigrants | Latin America | 0.0 /100 | #331 | Tragic 96.2% |
Demographics Similar to Immigrants from Albania by 3rd Grade
In terms of 3rd grade, the demographic groups most similar to Immigrants from Albania are Immigrants from Ukraine (97.7%, a difference of 0.0%), Immigrants from Lebanon (97.7%, a difference of 0.0%), Hawaiian (97.7%, a difference of 0.010%), Guamanian/Chamorro (97.7%, a difference of 0.010%), and Immigrants from Uganda (97.7%, a difference of 0.020%).
| Demographics | Rating | Rank | 3rd Grade |
| Immigrants | Kenya | 28.2 /100 | #193 | Fair 97.7% |
| Immigrants | Uganda | 27.4 /100 | #194 | Fair 97.7% |
| Immigrants | Egypt | 26.8 /100 | #195 | Fair 97.7% |
| Paraguayans | 26.2 /100 | #196 | Fair 97.7% |
| Hawaiians | 25.7 /100 | #197 | Fair 97.7% |
| Guamanians/Chamorros | 23.6 /100 | #198 | Fair 97.7% |
| Immigrants | Ukraine | 22.7 /100 | #199 | Fair 97.7% |
| Immigrants | Albania | 22.6 /100 | #200 | Fair 97.7% |
| Immigrants | Lebanon | 21.7 /100 | #201 | Fair 97.7% |
| Immigrants | Southern Europe | 17.7 /100 | #202 | Poor 97.6% |
| Paiute | 16.7 /100 | #203 | Poor 97.6% |
| Immigrants | Chile | 16.5 /100 | #204 | Poor 97.6% |
| Africans | 14.5 /100 | #205 | Poor 97.6% |
| Immigrants | Northern Africa | 13.0 /100 | #206 | Poor 97.6% |
| Tohono O'odham | 12.5 /100 | #207 | Poor 97.6% |