Immigrants from Saudi Arabia vs Immigrants from Ethiopia Bachelor's Degree
COMPARE
Immigrants from Saudi Arabia
Immigrants from Ethiopia
Bachelor's Degree
Bachelor's Degree Comparison
Immigrants from Saudi Arabia
Immigrants from Ethiopia
44.8%
BACHELOR'S DEGREE
100.0/ 100
METRIC RATING
42nd/ 347
METRIC RANK
42.5%
BACHELOR'S DEGREE
99.4/ 100
METRIC RATING
78th/ 347
METRIC RANK
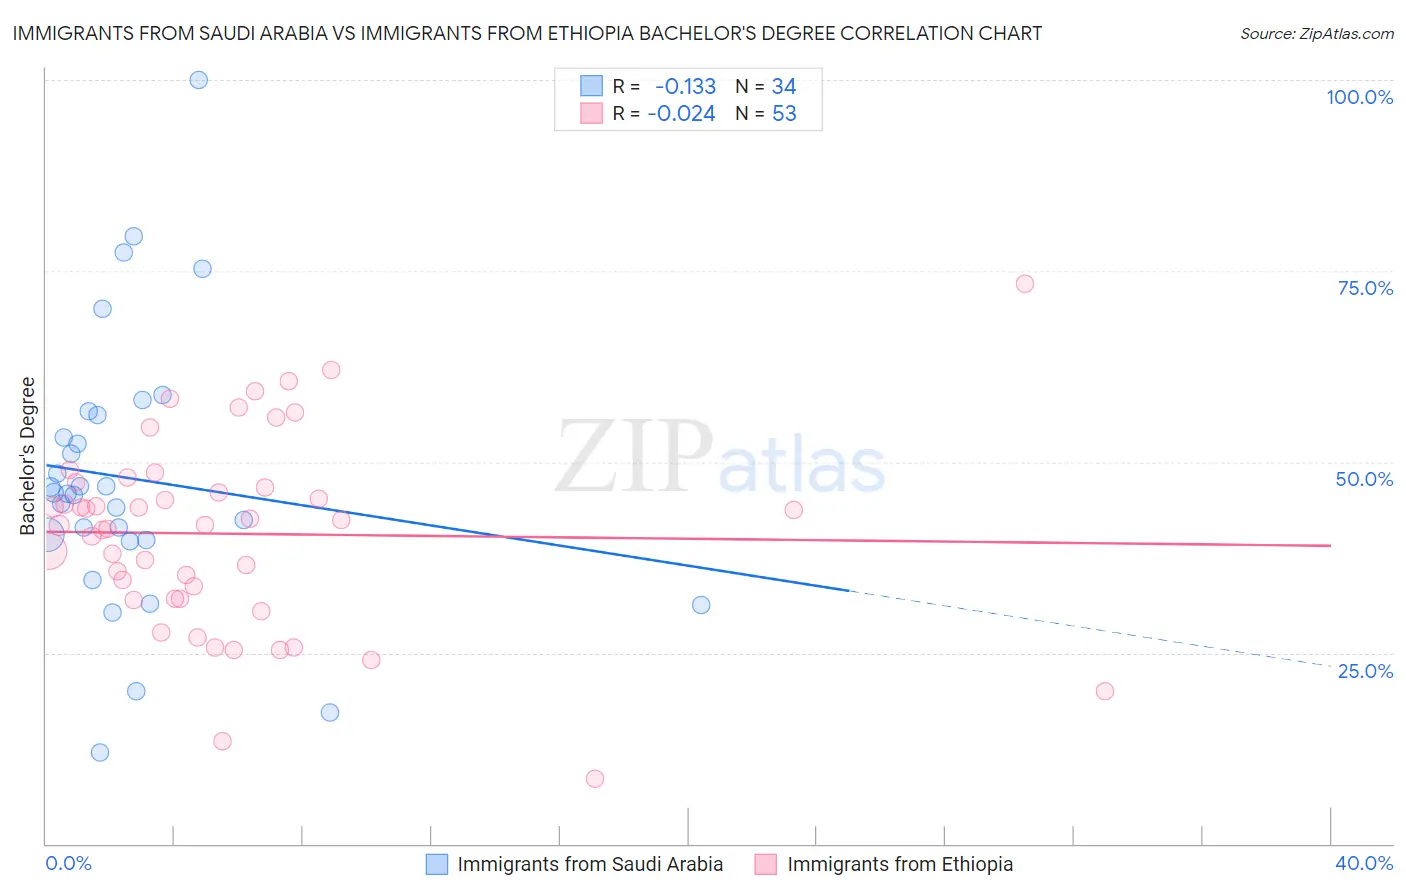
Immigrants from Saudi Arabia vs Immigrants from Ethiopia Bachelor's Degree Correlation Chart
The statistical analysis conducted on geographies consisting of 164,289,450 people shows a poor negative correlation between the proportion of Immigrants from Saudi Arabia and percentage of population with at least bachelor's degree education in the United States with a correlation coefficient (R) of -0.133 and weighted average of 44.8%. Similarly, the statistical analysis conducted on geographies consisting of 211,546,293 people shows no correlation between the proportion of Immigrants from Ethiopia and percentage of population with at least bachelor's degree education in the United States with a correlation coefficient (R) of -0.024 and weighted average of 42.5%, a difference of 5.6%.
Bachelor's Degree Correlation Summary
| Measurement | Immigrants from Saudi Arabia | Immigrants from Ethiopia |
| Minimum | 11.9% | 8.6% |
| Maximum | 100.0% | 73.3% |
| Range | 88.1% | 64.8% |
| Mean | 47.8% | 40.6% |
| Median | 45.9% | 41.8% |
| Interquartile 25% (IQ1) | 39.7% | 32.1% |
| Interquartile 75% (IQ3) | 56.1% | 46.9% |
| Interquartile Range (IQR) | 16.4% | 14.8% |
| Standard Deviation (Sample) | 18.0% | 12.6% |
| Standard Deviation (Population) | 17.7% | 12.4% |
Similar Demographics by Bachelor's Degree
Demographics Similar to Immigrants from Saudi Arabia by Bachelor's Degree
In terms of bachelor's degree, the demographic groups most similar to Immigrants from Saudi Arabia are Immigrants from South Africa (44.8%, a difference of 0.14%), Immigrants from Malaysia (45.0%, a difference of 0.38%), Immigrants from Belarus (45.0%, a difference of 0.42%), Immigrants from Lithuania (44.6%, a difference of 0.49%), and Immigrants from Kuwait (44.6%, a difference of 0.52%).
| Demographics | Rating | Rank | Bachelor's Degree |
| Immigrants | Russia | 100.0 /100 | #35 | Exceptional 45.4% |
| Mongolians | 100.0 /100 | #36 | Exceptional 45.4% |
| Russians | 100.0 /100 | #37 | Exceptional 45.3% |
| Bulgarians | 100.0 /100 | #38 | Exceptional 45.3% |
| Immigrants | Latvia | 100.0 /100 | #39 | Exceptional 45.1% |
| Immigrants | Belarus | 100.0 /100 | #40 | Exceptional 45.0% |
| Immigrants | Malaysia | 100.0 /100 | #41 | Exceptional 45.0% |
| Immigrants | Saudi Arabia | 100.0 /100 | #42 | Exceptional 44.8% |
| Immigrants | South Africa | 99.9 /100 | #43 | Exceptional 44.8% |
| Immigrants | Lithuania | 99.9 /100 | #44 | Exceptional 44.6% |
| Immigrants | Kuwait | 99.9 /100 | #45 | Exceptional 44.6% |
| Immigrants | Bulgaria | 99.9 /100 | #46 | Exceptional 44.6% |
| Bolivians | 99.9 /100 | #47 | Exceptional 44.6% |
| Estonians | 99.9 /100 | #48 | Exceptional 44.6% |
| Immigrants | Norway | 99.9 /100 | #49 | Exceptional 44.5% |
Demographics Similar to Immigrants from Ethiopia by Bachelor's Degree
In terms of bachelor's degree, the demographic groups most similar to Immigrants from Ethiopia are Immigrants from Eastern Europe (42.5%, a difference of 0.060%), Immigrants from Lebanon (42.4%, a difference of 0.17%), Immigrants from Egypt (42.6%, a difference of 0.24%), Immigrants from Zimbabwe (42.6%, a difference of 0.26%), and Immigrants from Croatia (42.3%, a difference of 0.36%).
| Demographics | Rating | Rank | Bachelor's Degree |
| Immigrants | Argentina | 99.6 /100 | #71 | Exceptional 42.8% |
| Ethiopians | 99.5 /100 | #72 | Exceptional 42.8% |
| Immigrants | Uzbekistan | 99.5 /100 | #73 | Exceptional 42.8% |
| Bhutanese | 99.5 /100 | #74 | Exceptional 42.7% |
| Immigrants | Zimbabwe | 99.4 /100 | #75 | Exceptional 42.6% |
| Immigrants | Egypt | 99.4 /100 | #76 | Exceptional 42.6% |
| Immigrants | Eastern Europe | 99.4 /100 | #77 | Exceptional 42.5% |
| Immigrants | Ethiopia | 99.4 /100 | #78 | Exceptional 42.5% |
| Immigrants | Lebanon | 99.3 /100 | #79 | Exceptional 42.4% |
| Immigrants | Croatia | 99.2 /100 | #80 | Exceptional 42.3% |
| Immigrants | Hungary | 99.2 /100 | #81 | Exceptional 42.3% |
| Immigrants | Scotland | 99.2 /100 | #82 | Exceptional 42.3% |
| Armenians | 99.2 /100 | #83 | Exceptional 42.3% |
| Immigrants | Western Asia | 99.2 /100 | #84 | Exceptional 42.3% |
| Lithuanians | 99.2 /100 | #85 | Exceptional 42.2% |