Bangladeshi vs Bolivian 10th Grade
COMPARE
Bangladeshi
Bolivian
10th Grade
10th Grade Comparison
Bangladeshis
Bolivians
92.2%
10TH GRADE
0.1/ 100
METRIC RATING
281st/ 347
METRIC RANK
93.2%
10TH GRADE
6.7/ 100
METRIC RATING
224th/ 347
METRIC RANK
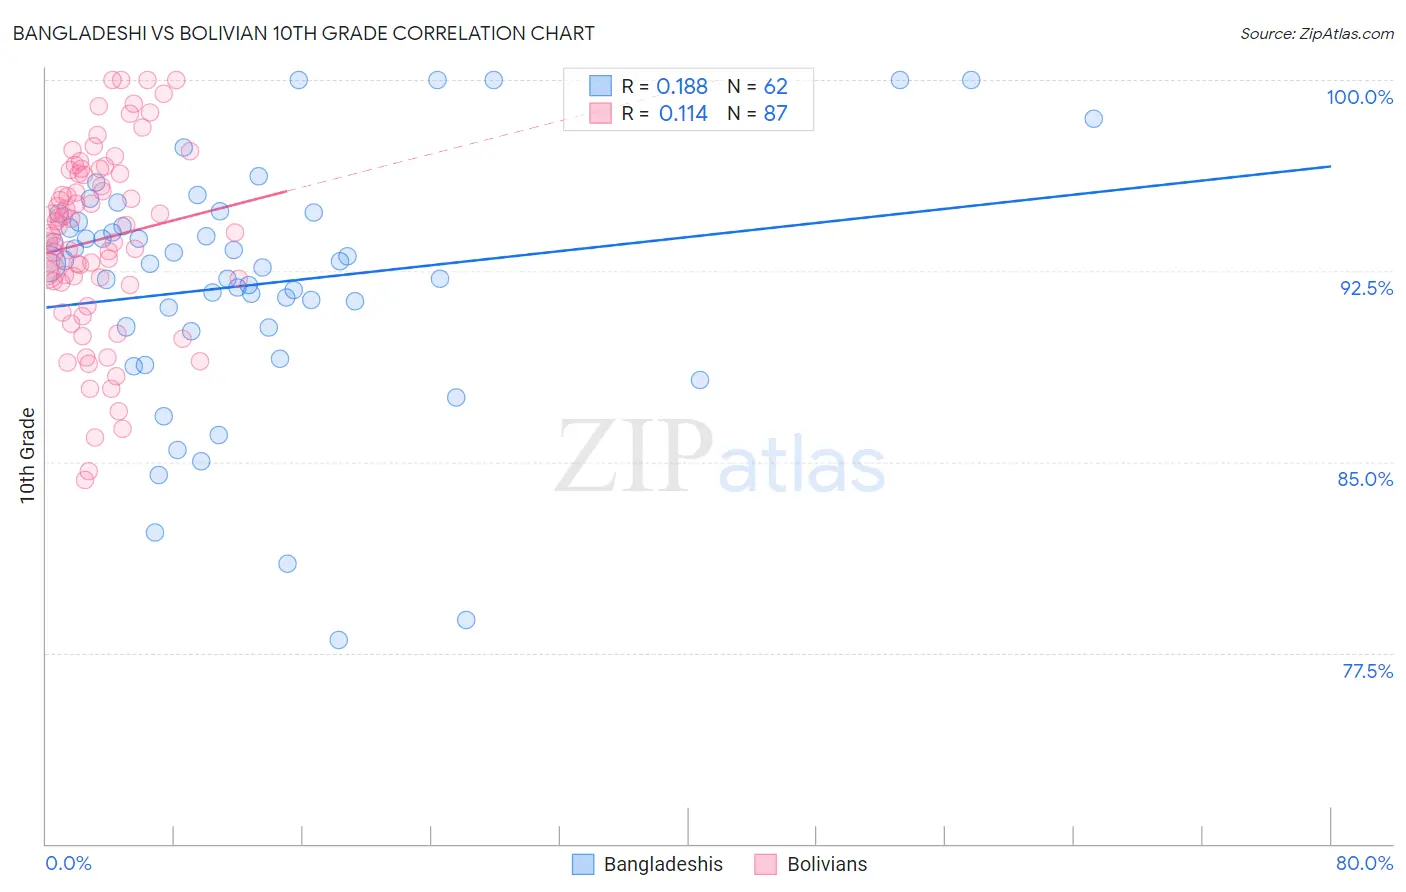
Bangladeshi vs Bolivian 10th Grade Correlation Chart
The statistical analysis conducted on geographies consisting of 141,450,108 people shows a poor positive correlation between the proportion of Bangladeshis and percentage of population with at least 10th grade education in the United States with a correlation coefficient (R) of 0.188 and weighted average of 92.2%. Similarly, the statistical analysis conducted on geographies consisting of 184,666,822 people shows a poor positive correlation between the proportion of Bolivians and percentage of population with at least 10th grade education in the United States with a correlation coefficient (R) of 0.114 and weighted average of 93.2%, a difference of 1.1%.
10th Grade Correlation Summary
| Measurement | Bangladeshi | Bolivian |
| Minimum | 78.0% | 84.3% |
| Maximum | 100.0% | 100.0% |
| Range | 22.0% | 15.7% |
| Mean | 92.0% | 93.7% |
| Median | 92.8% | 94.0% |
| Interquartile 25% (IQ1) | 90.3% | 92.0% |
| Interquartile 75% (IQ3) | 94.4% | 96.3% |
| Interquartile Range (IQR) | 4.2% | 4.3% |
| Standard Deviation (Sample) | 4.8% | 3.6% |
| Standard Deviation (Population) | 4.8% | 3.6% |
Similar Demographics by 10th Grade
Demographics Similar to Bangladeshis by 10th Grade
In terms of 10th grade, the demographic groups most similar to Bangladeshis are Malaysian (92.2%, a difference of 0.010%), Immigrants from Peru (92.2%, a difference of 0.020%), Barbadian (92.2%, a difference of 0.040%), Native/Alaskan (92.2%, a difference of 0.040%), and Navajo (92.3%, a difference of 0.080%).
| Demographics | Rating | Rank | 10th Grade |
| Immigrants | Congo | 0.2 /100 | #274 | Tragic 92.4% |
| West Indians | 0.2 /100 | #275 | Tragic 92.4% |
| Immigrants | Trinidad and Tobago | 0.1 /100 | #276 | Tragic 92.3% |
| Navajo | 0.1 /100 | #277 | Tragic 92.3% |
| Barbadians | 0.1 /100 | #278 | Tragic 92.2% |
| Natives/Alaskans | 0.1 /100 | #279 | Tragic 92.2% |
| Malaysians | 0.1 /100 | #280 | Tragic 92.2% |
| Bangladeshis | 0.1 /100 | #281 | Tragic 92.2% |
| Immigrants | Peru | 0.1 /100 | #282 | Tragic 92.2% |
| Immigrants | St. Vincent and the Grenadines | 0.0 /100 | #283 | Tragic 92.1% |
| Immigrants | Barbados | 0.0 /100 | #284 | Tragic 92.1% |
| Immigrants | South Eastern Asia | 0.0 /100 | #285 | Tragic 92.1% |
| Yuman | 0.0 /100 | #286 | Tragic 92.0% |
| Pennsylvania Germans | 0.0 /100 | #287 | Tragic 91.9% |
| Immigrants | Laos | 0.0 /100 | #288 | Tragic 91.9% |
Demographics Similar to Bolivians by 10th Grade
In terms of 10th grade, the demographic groups most similar to Bolivians are Somali (93.2%, a difference of 0.020%), Korean (93.2%, a difference of 0.020%), Black/African American (93.2%, a difference of 0.020%), Immigrants from Sierra Leone (93.2%, a difference of 0.030%), and Immigrants from China (93.2%, a difference of 0.030%).
| Demographics | Rating | Rank | 10th Grade |
| Portuguese | 12.1 /100 | #217 | Poor 93.3% |
| Immigrants | Liberia | 10.2 /100 | #218 | Poor 93.3% |
| Seminole | 10.2 /100 | #219 | Poor 93.3% |
| Tongans | 9.5 /100 | #220 | Tragic 93.3% |
| Immigrants | Southern Europe | 8.9 /100 | #221 | Tragic 93.2% |
| Ethiopians | 7.9 /100 | #222 | Tragic 93.2% |
| Immigrants | Sierra Leone | 7.6 /100 | #223 | Tragic 93.2% |
| Bolivians | 6.7 /100 | #224 | Tragic 93.2% |
| Somalis | 6.2 /100 | #225 | Tragic 93.2% |
| Koreans | 6.1 /100 | #226 | Tragic 93.2% |
| Blacks/African Americans | 6.0 /100 | #227 | Tragic 93.2% |
| Immigrants | China | 5.9 /100 | #228 | Tragic 93.2% |
| Immigrants | Ethiopia | 5.1 /100 | #229 | Tragic 93.1% |
| Immigrants | Africa | 5.0 /100 | #230 | Tragic 93.1% |
| South American Indians | 4.9 /100 | #231 | Tragic 93.1% |