Bangladeshi vs Bolivian Unemployment Among Ages 16 to 19 years
COMPARE
Bangladeshi
Bolivian
Unemployment Among Ages 16 to 19 years
Unemployment Among Ages 16 to 19 years Comparison
Bangladeshis
Bolivians
16.9%
UNEMPLOYMENT AMONG AGES 16 TO 19 YEARS
95.8/ 100
METRIC RATING
94th/ 347
METRIC RANK
17.3%
UNEMPLOYMENT AMONG AGES 16 TO 19 YEARS
81.9/ 100
METRIC RATING
138th/ 347
METRIC RANK
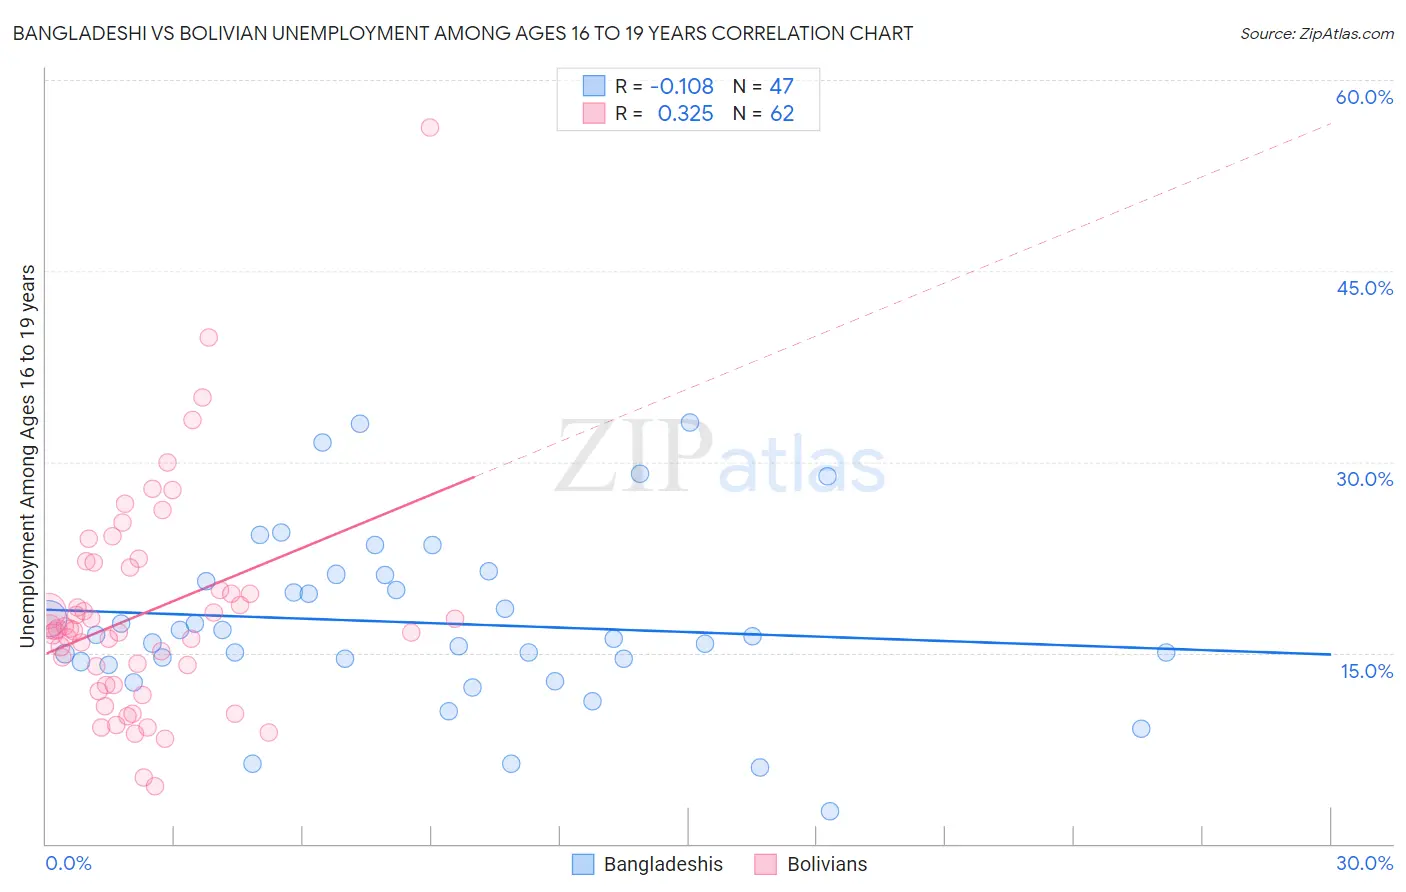
Bangladeshi vs Bolivian Unemployment Among Ages 16 to 19 years Correlation Chart
The statistical analysis conducted on geographies consisting of 138,581,653 people shows a poor negative correlation between the proportion of Bangladeshis and unemployment rate among population between the ages 16 and 19 in the United States with a correlation coefficient (R) of -0.108 and weighted average of 16.9%. Similarly, the statistical analysis conducted on geographies consisting of 179,875,457 people shows a mild positive correlation between the proportion of Bolivians and unemployment rate among population between the ages 16 and 19 in the United States with a correlation coefficient (R) of 0.325 and weighted average of 17.3%, a difference of 2.0%.
Unemployment Among Ages 16 to 19 years Correlation Summary
| Measurement | Bangladeshi | Bolivian |
| Minimum | 2.6% | 4.5% |
| Maximum | 33.1% | 56.3% |
| Range | 30.5% | 51.8% |
| Mean | 17.4% | 18.1% |
| Median | 16.3% | 16.8% |
| Interquartile 25% (IQ1) | 14.3% | 12.5% |
| Interquartile 75% (IQ3) | 21.1% | 21.7% |
| Interquartile Range (IQR) | 6.8% | 9.2% |
| Standard Deviation (Sample) | 6.8% | 8.6% |
| Standard Deviation (Population) | 6.7% | 8.5% |
Similar Demographics by Unemployment Among Ages 16 to 19 years
Demographics Similar to Bangladeshis by Unemployment Among Ages 16 to 19 years
In terms of unemployment among ages 16 to 19 years, the demographic groups most similar to Bangladeshis are Cuban (16.9%, a difference of 0.010%), South African (16.9%, a difference of 0.050%), Mongolian (16.9%, a difference of 0.070%), Ottawa (16.9%, a difference of 0.10%), and Immigrants from Venezuela (16.9%, a difference of 0.13%).
| Demographics | Rating | Rank | Unemployment Among Ages 16 to 19 years |
| Greeks | 97.0 /100 | #87 | Exceptional 16.9% |
| Immigrants | South Africa | 96.9 /100 | #88 | Exceptional 16.9% |
| Canadians | 96.7 /100 | #89 | Exceptional 16.9% |
| Asians | 96.6 /100 | #90 | Exceptional 16.9% |
| Cambodians | 96.3 /100 | #91 | Exceptional 16.9% |
| South Africans | 95.9 /100 | #92 | Exceptional 16.9% |
| Cubans | 95.8 /100 | #93 | Exceptional 16.9% |
| Bangladeshis | 95.8 /100 | #94 | Exceptional 16.9% |
| Mongolians | 95.6 /100 | #95 | Exceptional 16.9% |
| Ottawa | 95.4 /100 | #96 | Exceptional 16.9% |
| Immigrants | Venezuela | 95.3 /100 | #97 | Exceptional 16.9% |
| Burmese | 95.0 /100 | #98 | Exceptional 17.0% |
| Immigrants | Lithuania | 94.9 /100 | #99 | Exceptional 17.0% |
| Immigrants | Thailand | 94.7 /100 | #100 | Exceptional 17.0% |
| Immigrants | Saudi Arabia | 94.7 /100 | #101 | Exceptional 17.0% |
Demographics Similar to Bolivians by Unemployment Among Ages 16 to 19 years
In terms of unemployment among ages 16 to 19 years, the demographic groups most similar to Bolivians are Immigrants from Malaysia (17.2%, a difference of 0.070%), Immigrants from Eritrea (17.3%, a difference of 0.070%), Immigrants from Croatia (17.3%, a difference of 0.090%), Immigrants from Oceania (17.2%, a difference of 0.10%), and Basque (17.3%, a difference of 0.10%).
| Demographics | Rating | Rank | Unemployment Among Ages 16 to 19 years |
| German Russians | 84.1 /100 | #131 | Excellent 17.2% |
| Arabs | 83.9 /100 | #132 | Excellent 17.2% |
| Laotians | 83.9 /100 | #133 | Excellent 17.2% |
| Potawatomi | 83.8 /100 | #134 | Excellent 17.2% |
| Samoans | 83.7 /100 | #135 | Excellent 17.2% |
| Immigrants | Oceania | 83.1 /100 | #136 | Excellent 17.2% |
| Immigrants | Malaysia | 82.8 /100 | #137 | Excellent 17.2% |
| Bolivians | 81.9 /100 | #138 | Excellent 17.3% |
| Immigrants | Eritrea | 81.1 /100 | #139 | Excellent 17.3% |
| Immigrants | Croatia | 80.8 /100 | #140 | Excellent 17.3% |
| Basques | 80.7 /100 | #141 | Excellent 17.3% |
| Spanish | 79.3 /100 | #142 | Good 17.3% |
| Immigrants | Egypt | 79.1 /100 | #143 | Good 17.3% |
| Immigrants | England | 78.9 /100 | #144 | Good 17.3% |
| Indians (Asian) | 77.6 /100 | #145 | Good 17.3% |