Immigrants from Northern Europe vs Bolivian 10th Grade
COMPARE
Immigrants from Northern Europe
Bolivian
10th Grade
10th Grade Comparison
Immigrants from Northern Europe
Bolivians
95.2%
10TH GRADE
99.9/ 100
METRIC RATING
44th/ 347
METRIC RANK
93.2%
10TH GRADE
6.7/ 100
METRIC RATING
224th/ 347
METRIC RANK
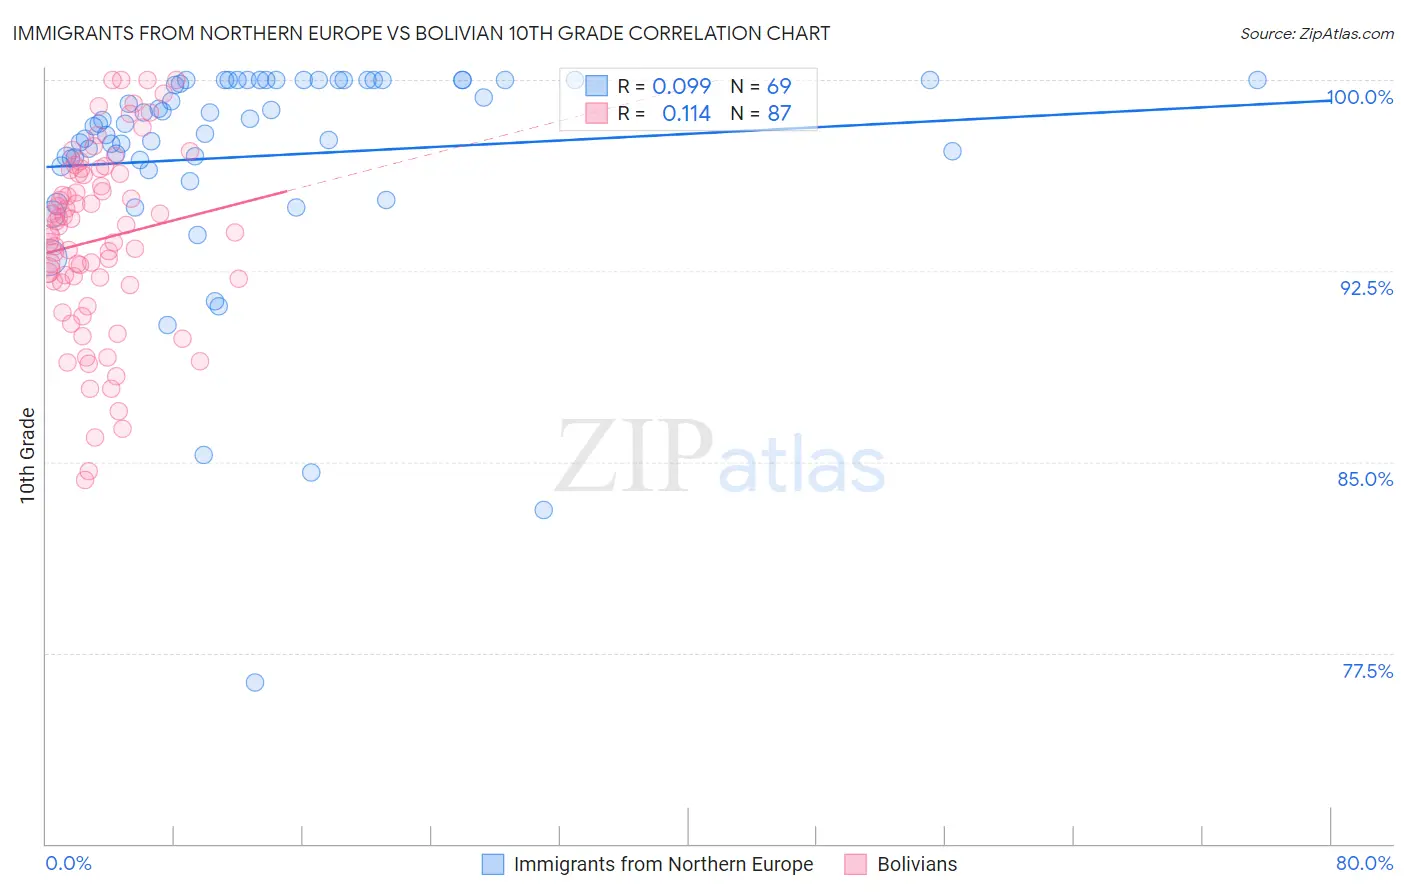
Immigrants from Northern Europe vs Bolivian 10th Grade Correlation Chart
The statistical analysis conducted on geographies consisting of 477,226,783 people shows a slight positive correlation between the proportion of Immigrants from Northern Europe and percentage of population with at least 10th grade education in the United States with a correlation coefficient (R) of 0.099 and weighted average of 95.2%. Similarly, the statistical analysis conducted on geographies consisting of 184,666,822 people shows a poor positive correlation between the proportion of Bolivians and percentage of population with at least 10th grade education in the United States with a correlation coefficient (R) of 0.114 and weighted average of 93.2%, a difference of 2.1%.
10th Grade Correlation Summary
| Measurement | Immigrants from Northern Europe | Bolivian |
| Minimum | 76.3% | 84.3% |
| Maximum | 100.0% | 100.0% |
| Range | 23.7% | 15.7% |
| Mean | 97.0% | 93.7% |
| Median | 98.3% | 94.0% |
| Interquartile 25% (IQ1) | 96.7% | 92.0% |
| Interquartile 75% (IQ3) | 100.0% | 96.3% |
| Interquartile Range (IQR) | 3.3% | 4.3% |
| Standard Deviation (Sample) | 4.4% | 3.6% |
| Standard Deviation (Population) | 4.4% | 3.6% |
Similar Demographics by 10th Grade
Demographics Similar to Immigrants from Northern Europe by 10th Grade
In terms of 10th grade, the demographic groups most similar to Immigrants from Northern Europe are Greek (95.2%, a difference of 0.0%), Macedonian (95.2%, a difference of 0.010%), Czechoslovakian (95.1%, a difference of 0.010%), Serbian (95.1%, a difference of 0.020%), and Slavic (95.2%, a difference of 0.030%).
| Demographics | Rating | Rank | 10th Grade |
| French Canadians | 99.9 /100 | #37 | Exceptional 95.3% |
| Northern Europeans | 99.9 /100 | #38 | Exceptional 95.3% |
| Immigrants | Scotland | 99.9 /100 | #39 | Exceptional 95.2% |
| Scotch-Irish | 99.9 /100 | #40 | Exceptional 95.2% |
| Russians | 99.9 /100 | #41 | Exceptional 95.2% |
| Slavs | 99.9 /100 | #42 | Exceptional 95.2% |
| Macedonians | 99.9 /100 | #43 | Exceptional 95.2% |
| Immigrants | Northern Europe | 99.9 /100 | #44 | Exceptional 95.2% |
| Greeks | 99.9 /100 | #45 | Exceptional 95.2% |
| Czechoslovakians | 99.9 /100 | #46 | Exceptional 95.1% |
| Serbians | 99.9 /100 | #47 | Exceptional 95.1% |
| Australians | 99.9 /100 | #48 | Exceptional 95.1% |
| Immigrants | Austria | 99.9 /100 | #49 | Exceptional 95.1% |
| Immigrants | Canada | 99.8 /100 | #50 | Exceptional 95.1% |
| Austrians | 99.8 /100 | #51 | Exceptional 95.1% |
Demographics Similar to Bolivians by 10th Grade
In terms of 10th grade, the demographic groups most similar to Bolivians are Somali (93.2%, a difference of 0.020%), Korean (93.2%, a difference of 0.020%), Black/African American (93.2%, a difference of 0.020%), Immigrants from Sierra Leone (93.2%, a difference of 0.030%), and Immigrants from China (93.2%, a difference of 0.030%).
| Demographics | Rating | Rank | 10th Grade |
| Portuguese | 12.1 /100 | #217 | Poor 93.3% |
| Immigrants | Liberia | 10.2 /100 | #218 | Poor 93.3% |
| Seminole | 10.2 /100 | #219 | Poor 93.3% |
| Tongans | 9.5 /100 | #220 | Tragic 93.3% |
| Immigrants | Southern Europe | 8.9 /100 | #221 | Tragic 93.2% |
| Ethiopians | 7.9 /100 | #222 | Tragic 93.2% |
| Immigrants | Sierra Leone | 7.6 /100 | #223 | Tragic 93.2% |
| Bolivians | 6.7 /100 | #224 | Tragic 93.2% |
| Somalis | 6.2 /100 | #225 | Tragic 93.2% |
| Koreans | 6.1 /100 | #226 | Tragic 93.2% |
| Blacks/African Americans | 6.0 /100 | #227 | Tragic 93.2% |
| Immigrants | China | 5.9 /100 | #228 | Tragic 93.2% |
| Immigrants | Ethiopia | 5.1 /100 | #229 | Tragic 93.1% |
| Immigrants | Africa | 5.0 /100 | #230 | Tragic 93.1% |
| South American Indians | 4.9 /100 | #231 | Tragic 93.1% |