Bangladeshi vs Ukrainian 10th Grade
COMPARE
Bangladeshi
Ukrainian
10th Grade
10th Grade Comparison
Bangladeshis
Ukrainians
92.2%
10TH GRADE
0.1/ 100
METRIC RATING
281st/ 347
METRIC RANK
95.0%
10TH GRADE
99.8/ 100
METRIC RATING
57th/ 347
METRIC RANK
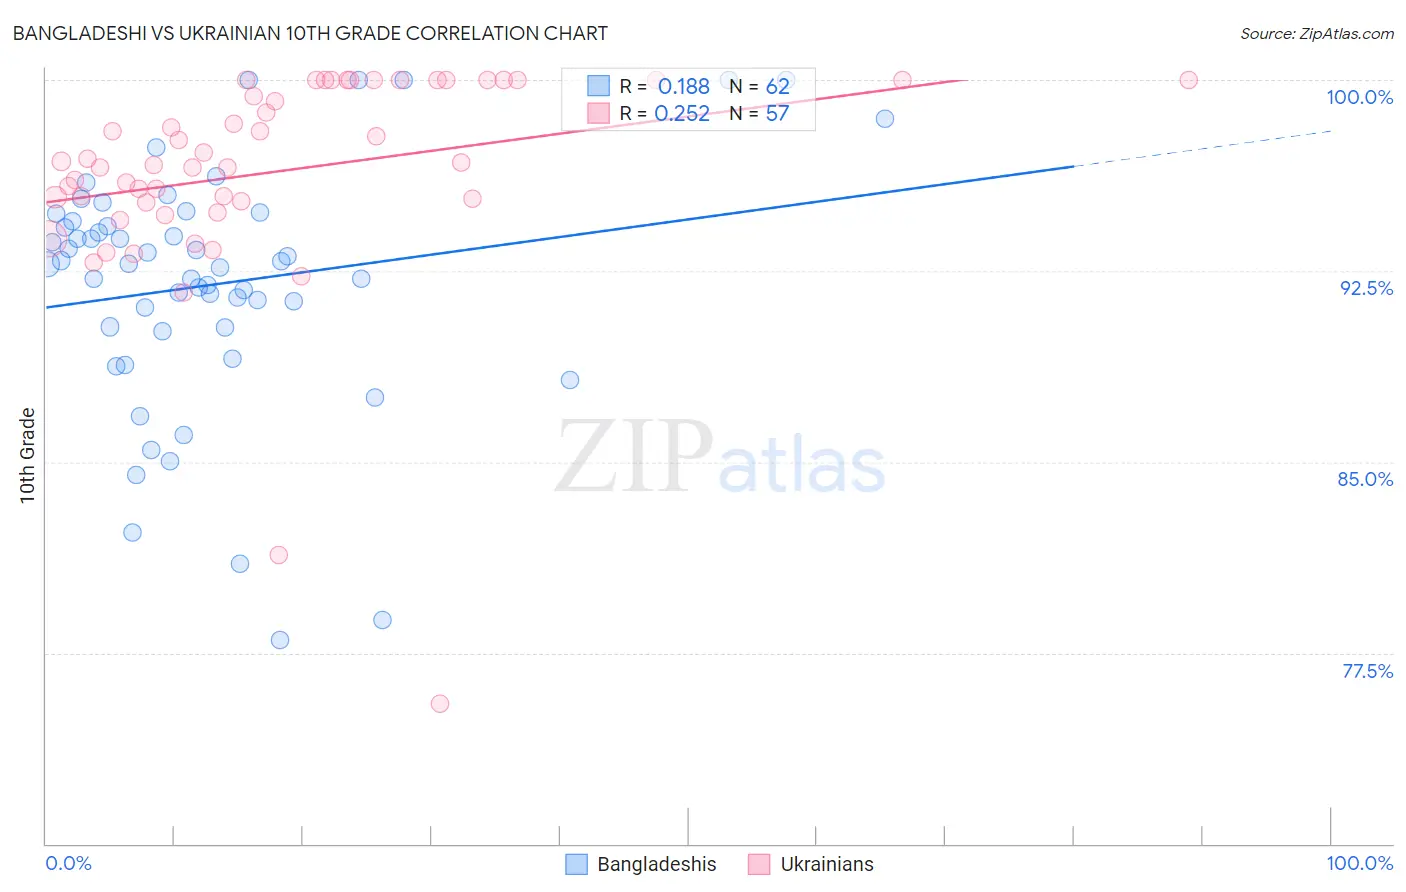
Bangladeshi vs Ukrainian 10th Grade Correlation Chart
The statistical analysis conducted on geographies consisting of 141,450,108 people shows a poor positive correlation between the proportion of Bangladeshis and percentage of population with at least 10th grade education in the United States with a correlation coefficient (R) of 0.188 and weighted average of 92.2%. Similarly, the statistical analysis conducted on geographies consisting of 448,698,772 people shows a weak positive correlation between the proportion of Ukrainians and percentage of population with at least 10th grade education in the United States with a correlation coefficient (R) of 0.252 and weighted average of 95.0%, a difference of 3.1%.
10th Grade Correlation Summary
| Measurement | Bangladeshi | Ukrainian |
| Minimum | 78.0% | 75.5% |
| Maximum | 100.0% | 100.0% |
| Range | 22.0% | 24.5% |
| Mean | 92.0% | 96.4% |
| Median | 92.8% | 96.7% |
| Interquartile 25% (IQ1) | 90.3% | 95.2% |
| Interquartile 75% (IQ3) | 94.4% | 100.0% |
| Interquartile Range (IQR) | 4.2% | 4.8% |
| Standard Deviation (Sample) | 4.8% | 4.3% |
| Standard Deviation (Population) | 4.8% | 4.2% |
Similar Demographics by 10th Grade
Demographics Similar to Bangladeshis by 10th Grade
In terms of 10th grade, the demographic groups most similar to Bangladeshis are Malaysian (92.2%, a difference of 0.010%), Immigrants from Peru (92.2%, a difference of 0.020%), Barbadian (92.2%, a difference of 0.040%), Native/Alaskan (92.2%, a difference of 0.040%), and Navajo (92.3%, a difference of 0.080%).
| Demographics | Rating | Rank | 10th Grade |
| Immigrants | Congo | 0.2 /100 | #274 | Tragic 92.4% |
| West Indians | 0.2 /100 | #275 | Tragic 92.4% |
| Immigrants | Trinidad and Tobago | 0.1 /100 | #276 | Tragic 92.3% |
| Navajo | 0.1 /100 | #277 | Tragic 92.3% |
| Barbadians | 0.1 /100 | #278 | Tragic 92.2% |
| Natives/Alaskans | 0.1 /100 | #279 | Tragic 92.2% |
| Malaysians | 0.1 /100 | #280 | Tragic 92.2% |
| Bangladeshis | 0.1 /100 | #281 | Tragic 92.2% |
| Immigrants | Peru | 0.1 /100 | #282 | Tragic 92.2% |
| Immigrants | St. Vincent and the Grenadines | 0.0 /100 | #283 | Tragic 92.1% |
| Immigrants | Barbados | 0.0 /100 | #284 | Tragic 92.1% |
| Immigrants | South Eastern Asia | 0.0 /100 | #285 | Tragic 92.1% |
| Yuman | 0.0 /100 | #286 | Tragic 92.0% |
| Pennsylvania Germans | 0.0 /100 | #287 | Tragic 91.9% |
| Immigrants | Laos | 0.0 /100 | #288 | Tragic 91.9% |
Demographics Similar to Ukrainians by 10th Grade
In terms of 10th grade, the demographic groups most similar to Ukrainians are New Zealander (95.0%, a difference of 0.0%), Aleut (95.0%, a difference of 0.0%), Immigrants from Ireland (95.0%, a difference of 0.010%), Celtic (95.0%, a difference of 0.010%), and Immigrants from Lithuania (95.0%, a difference of 0.020%).
| Demographics | Rating | Rank | 10th Grade |
| Immigrants | Canada | 99.8 /100 | #50 | Exceptional 95.1% |
| Austrians | 99.8 /100 | #51 | Exceptional 95.1% |
| Ottawa | 99.8 /100 | #52 | Exceptional 95.1% |
| Immigrants | North America | 99.8 /100 | #53 | Exceptional 95.0% |
| Immigrants | Lithuania | 99.8 /100 | #54 | Exceptional 95.0% |
| Immigrants | Ireland | 99.8 /100 | #55 | Exceptional 95.0% |
| New Zealanders | 99.8 /100 | #56 | Exceptional 95.0% |
| Ukrainians | 99.8 /100 | #57 | Exceptional 95.0% |
| Aleuts | 99.8 /100 | #58 | Exceptional 95.0% |
| Celtics | 99.8 /100 | #59 | Exceptional 95.0% |
| Cypriots | 99.8 /100 | #60 | Exceptional 95.0% |
| Chippewa | 99.8 /100 | #61 | Exceptional 95.0% |
| Thais | 99.8 /100 | #62 | Exceptional 95.0% |
| Immigrants | Singapore | 99.8 /100 | #63 | Exceptional 95.0% |
| Native Hawaiians | 99.7 /100 | #64 | Exceptional 95.0% |