Bangladeshi vs Zimbabwean 10th Grade
COMPARE
Bangladeshi
Zimbabwean
10th Grade
10th Grade Comparison
Bangladeshis
Zimbabweans
92.2%
10TH GRADE
0.1/ 100
METRIC RATING
281st/ 347
METRIC RANK
94.9%
10TH GRADE
99.6/ 100
METRIC RATING
70th/ 347
METRIC RANK
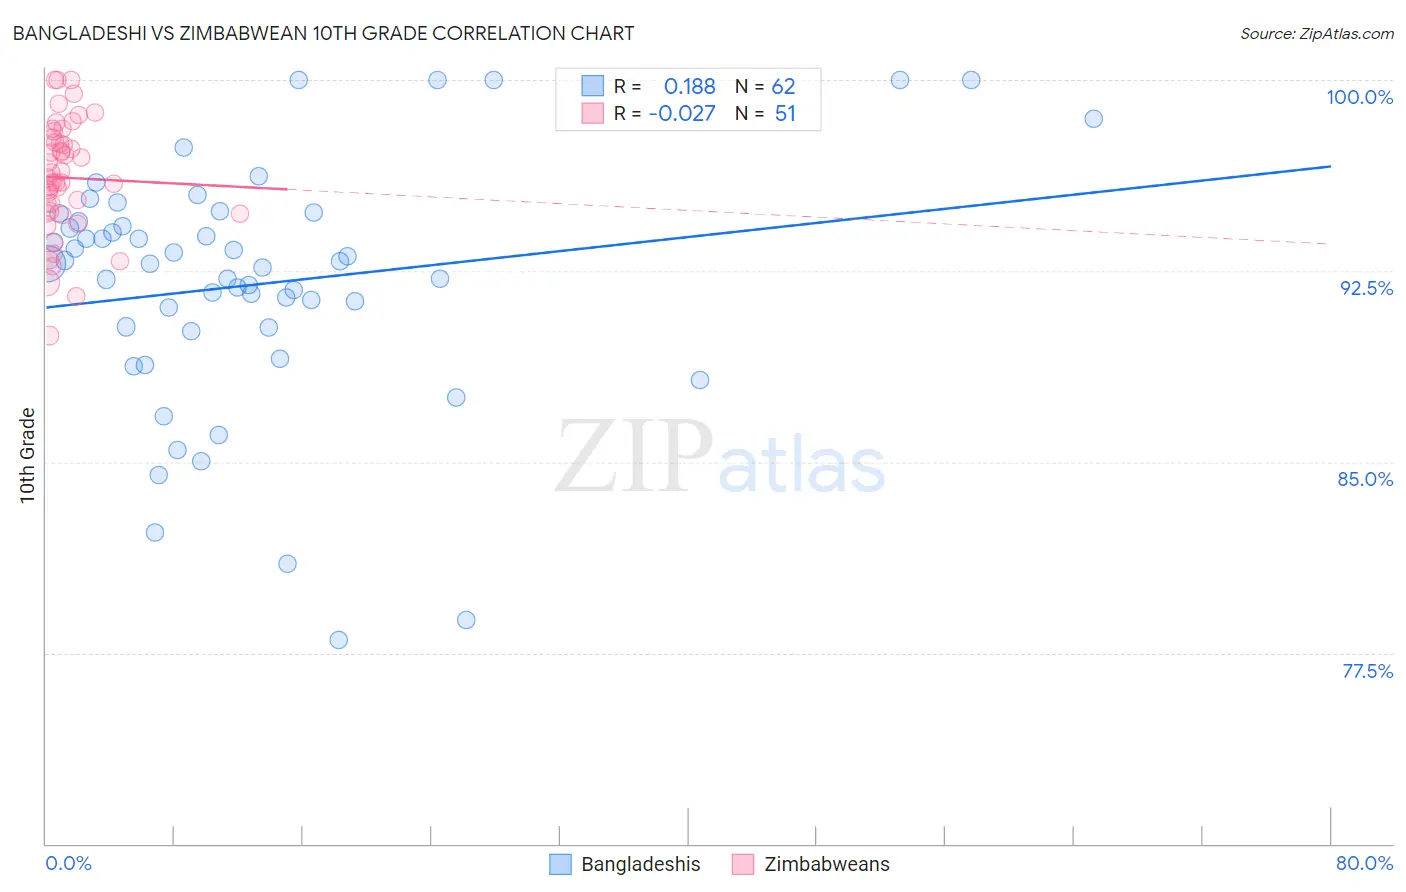
Bangladeshi vs Zimbabwean 10th Grade Correlation Chart
The statistical analysis conducted on geographies consisting of 141,450,108 people shows a poor positive correlation between the proportion of Bangladeshis and percentage of population with at least 10th grade education in the United States with a correlation coefficient (R) of 0.188 and weighted average of 92.2%. Similarly, the statistical analysis conducted on geographies consisting of 69,203,423 people shows no correlation between the proportion of Zimbabweans and percentage of population with at least 10th grade education in the United States with a correlation coefficient (R) of -0.027 and weighted average of 94.9%, a difference of 2.9%.
10th Grade Correlation Summary
| Measurement | Bangladeshi | Zimbabwean |
| Minimum | 78.0% | 90.0% |
| Maximum | 100.0% | 100.0% |
| Range | 22.0% | 10.0% |
| Mean | 92.0% | 96.2% |
| Median | 92.8% | 96.1% |
| Interquartile 25% (IQ1) | 90.3% | 94.8% |
| Interquartile 75% (IQ3) | 94.4% | 97.8% |
| Interquartile Range (IQR) | 4.2% | 3.0% |
| Standard Deviation (Sample) | 4.8% | 2.3% |
| Standard Deviation (Population) | 4.8% | 2.2% |
Similar Demographics by 10th Grade
Demographics Similar to Bangladeshis by 10th Grade
In terms of 10th grade, the demographic groups most similar to Bangladeshis are Malaysian (92.2%, a difference of 0.010%), Immigrants from Peru (92.2%, a difference of 0.020%), Barbadian (92.2%, a difference of 0.040%), Native/Alaskan (92.2%, a difference of 0.040%), and Navajo (92.3%, a difference of 0.080%).
| Demographics | Rating | Rank | 10th Grade |
| Immigrants | Congo | 0.2 /100 | #274 | Tragic 92.4% |
| West Indians | 0.2 /100 | #275 | Tragic 92.4% |
| Immigrants | Trinidad and Tobago | 0.1 /100 | #276 | Tragic 92.3% |
| Navajo | 0.1 /100 | #277 | Tragic 92.3% |
| Barbadians | 0.1 /100 | #278 | Tragic 92.2% |
| Natives/Alaskans | 0.1 /100 | #279 | Tragic 92.2% |
| Malaysians | 0.1 /100 | #280 | Tragic 92.2% |
| Bangladeshis | 0.1 /100 | #281 | Tragic 92.2% |
| Immigrants | Peru | 0.1 /100 | #282 | Tragic 92.2% |
| Immigrants | St. Vincent and the Grenadines | 0.0 /100 | #283 | Tragic 92.1% |
| Immigrants | Barbados | 0.0 /100 | #284 | Tragic 92.1% |
| Immigrants | South Eastern Asia | 0.0 /100 | #285 | Tragic 92.1% |
| Yuman | 0.0 /100 | #286 | Tragic 92.0% |
| Pennsylvania Germans | 0.0 /100 | #287 | Tragic 91.9% |
| Immigrants | Laos | 0.0 /100 | #288 | Tragic 91.9% |
Demographics Similar to Zimbabweans by 10th Grade
In terms of 10th grade, the demographic groups most similar to Zimbabweans are Alaska Native (94.9%, a difference of 0.0%), Immigrants from England (94.9%, a difference of 0.010%), Immigrants from Sweden (94.9%, a difference of 0.020%), Bhutanese (94.9%, a difference of 0.020%), and Immigrants from Australia (94.9%, a difference of 0.030%).
| Demographics | Rating | Rank | 10th Grade |
| Immigrants | Singapore | 99.8 /100 | #63 | Exceptional 95.0% |
| Native Hawaiians | 99.7 /100 | #64 | Exceptional 95.0% |
| Turks | 99.7 /100 | #65 | Exceptional 95.0% |
| Immigrants | Australia | 99.7 /100 | #66 | Exceptional 94.9% |
| Immigrants | Netherlands | 99.7 /100 | #67 | Exceptional 94.9% |
| Immigrants | Belgium | 99.7 /100 | #68 | Exceptional 94.9% |
| Immigrants | England | 99.6 /100 | #69 | Exceptional 94.9% |
| Zimbabweans | 99.6 /100 | #70 | Exceptional 94.9% |
| Alaska Natives | 99.6 /100 | #71 | Exceptional 94.9% |
| Immigrants | Sweden | 99.6 /100 | #72 | Exceptional 94.9% |
| Bhutanese | 99.6 /100 | #73 | Exceptional 94.9% |
| Canadians | 99.6 /100 | #74 | Exceptional 94.9% |
| Okinawans | 99.5 /100 | #75 | Exceptional 94.8% |
| Romanians | 99.5 /100 | #76 | Exceptional 94.8% |
| Immigrants | South Africa | 99.5 /100 | #77 | Exceptional 94.8% |