Bangladeshi vs Croatian No Schooling Completed
COMPARE
Bangladeshi
Croatian
No Schooling Completed
No Schooling Completed Comparison
Bangladeshis
Croatians
3.5%
NO SCHOOLING COMPLETED
0.0/ 100
METRIC RATING
338th/ 347
METRIC RANK
1.5%
NO SCHOOLING COMPLETED
100.0/ 100
METRIC RATING
17th/ 347
METRIC RANK
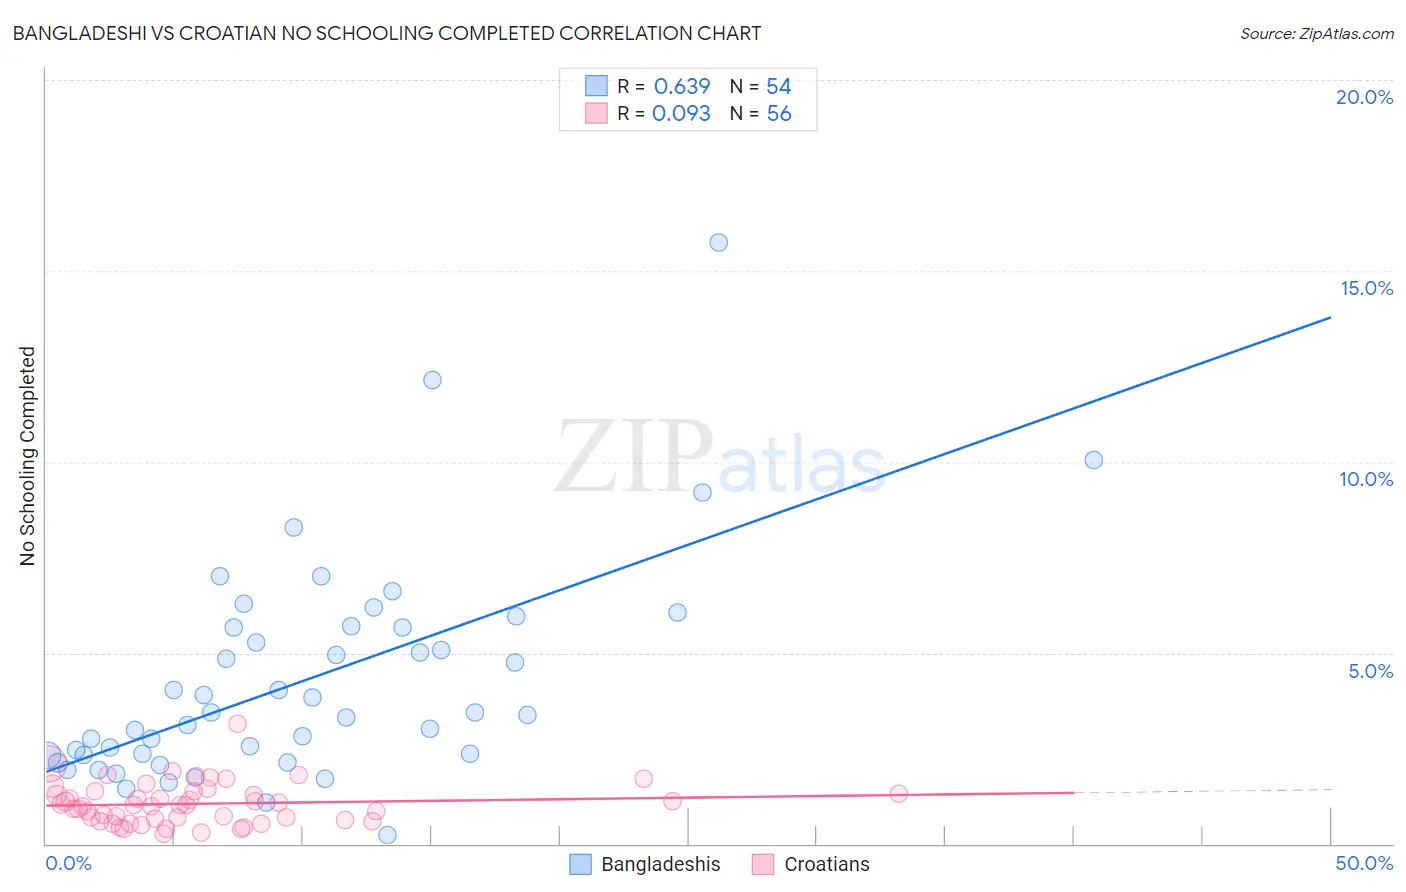
Bangladeshi vs Croatian No Schooling Completed Correlation Chart
The statistical analysis conducted on geographies consisting of 140,674,207 people shows a significant positive correlation between the proportion of Bangladeshis and percentage of population with no schooling in the United States with a correlation coefficient (R) of 0.639 and weighted average of 3.5%. Similarly, the statistical analysis conducted on geographies consisting of 370,650,548 people shows a slight positive correlation between the proportion of Croatians and percentage of population with no schooling in the United States with a correlation coefficient (R) of 0.093 and weighted average of 1.5%, a difference of 142.6%.
No Schooling Completed Correlation Summary
| Measurement | Bangladeshi | Croatian |
| Minimum | 0.24% | 0.27% |
| Maximum | 15.7% | 3.1% |
| Range | 15.5% | 2.9% |
| Mean | 4.3% | 1.0% |
| Median | 3.4% | 1.0% |
| Interquartile 25% (IQ1) | 2.3% | 0.65% |
| Interquartile 75% (IQ3) | 5.7% | 1.3% |
| Interquartile Range (IQR) | 3.3% | 0.68% |
| Standard Deviation (Sample) | 2.9% | 0.54% |
| Standard Deviation (Population) | 2.8% | 0.54% |
Similar Demographics by No Schooling Completed
Demographics Similar to Bangladeshis by No Schooling Completed
In terms of no schooling completed, the demographic groups most similar to Bangladeshis are Immigrants from Cabo Verde (3.5%, a difference of 0.23%), Yakama (3.6%, a difference of 0.31%), Immigrants from Fiji (3.5%, a difference of 0.95%), Immigrants from Guatemala (3.6%, a difference of 1.0%), and Immigrants from Cambodia (3.5%, a difference of 1.3%).
| Demographics | Rating | Rank | No Schooling Completed |
| Japanese | 0.0 /100 | #331 | Tragic 3.3% |
| Central Americans | 0.0 /100 | #332 | Tragic 3.4% |
| Immigrants | Dominican Republic | 0.0 /100 | #333 | Tragic 3.4% |
| Guatemalans | 0.0 /100 | #334 | Tragic 3.5% |
| Immigrants | Cambodia | 0.0 /100 | #335 | Tragic 3.5% |
| Immigrants | Fiji | 0.0 /100 | #336 | Tragic 3.5% |
| Immigrants | Cabo Verde | 0.0 /100 | #337 | Tragic 3.5% |
| Bangladeshis | 0.0 /100 | #338 | Tragic 3.5% |
| Yakama | 0.0 /100 | #339 | Tragic 3.6% |
| Immigrants | Guatemala | 0.0 /100 | #340 | Tragic 3.6% |
| Immigrants | Central America | 0.0 /100 | #341 | Tragic 3.6% |
| Immigrants | Mexico | 0.0 /100 | #342 | Tragic 3.6% |
| Salvadorans | 0.0 /100 | #343 | Tragic 3.7% |
| Nepalese | 0.0 /100 | #344 | Tragic 3.8% |
| Immigrants | El Salvador | 0.0 /100 | #345 | Tragic 3.9% |
Demographics Similar to Croatians by No Schooling Completed
In terms of no schooling completed, the demographic groups most similar to Croatians are Finnish (1.5%, a difference of 0.010%), Danish (1.5%, a difference of 0.30%), Alaskan Athabascan (1.5%, a difference of 0.41%), Tlingit-Haida (1.5%, a difference of 0.53%), and Welsh (1.5%, a difference of 0.53%).
| Demographics | Rating | Rank | No Schooling Completed |
| Dutch | 100.0 /100 | #10 | Exceptional 1.4% |
| Lithuanians | 100.0 /100 | #11 | Exceptional 1.4% |
| Irish | 100.0 /100 | #12 | Exceptional 1.4% |
| Poles | 100.0 /100 | #13 | Exceptional 1.4% |
| Scotch-Irish | 100.0 /100 | #14 | Exceptional 1.5% |
| Tlingit-Haida | 100.0 /100 | #15 | Exceptional 1.5% |
| Finns | 100.0 /100 | #16 | Exceptional 1.5% |
| Croatians | 100.0 /100 | #17 | Exceptional 1.5% |
| Danes | 100.0 /100 | #18 | Exceptional 1.5% |
| Alaskan Athabascans | 100.0 /100 | #19 | Exceptional 1.5% |
| Welsh | 100.0 /100 | #20 | Exceptional 1.5% |
| Chinese | 100.0 /100 | #21 | Exceptional 1.5% |
| Alaska Natives | 100.0 /100 | #22 | Exceptional 1.5% |
| Europeans | 100.0 /100 | #23 | Exceptional 1.5% |
| Pennsylvania Germans | 100.0 /100 | #24 | Exceptional 1.5% |