Immigrants from Liberia vs Navajo 7th Grade
COMPARE
Immigrants from Liberia
Navajo
7th Grade
7th Grade Comparison
Immigrants from Liberia
Navajo
95.7%
7TH GRADE
8.1/ 100
METRIC RATING
218th/ 347
METRIC RANK
95.8%
7TH GRADE
17.0/ 100
METRIC RATING
207th/ 347
METRIC RANK
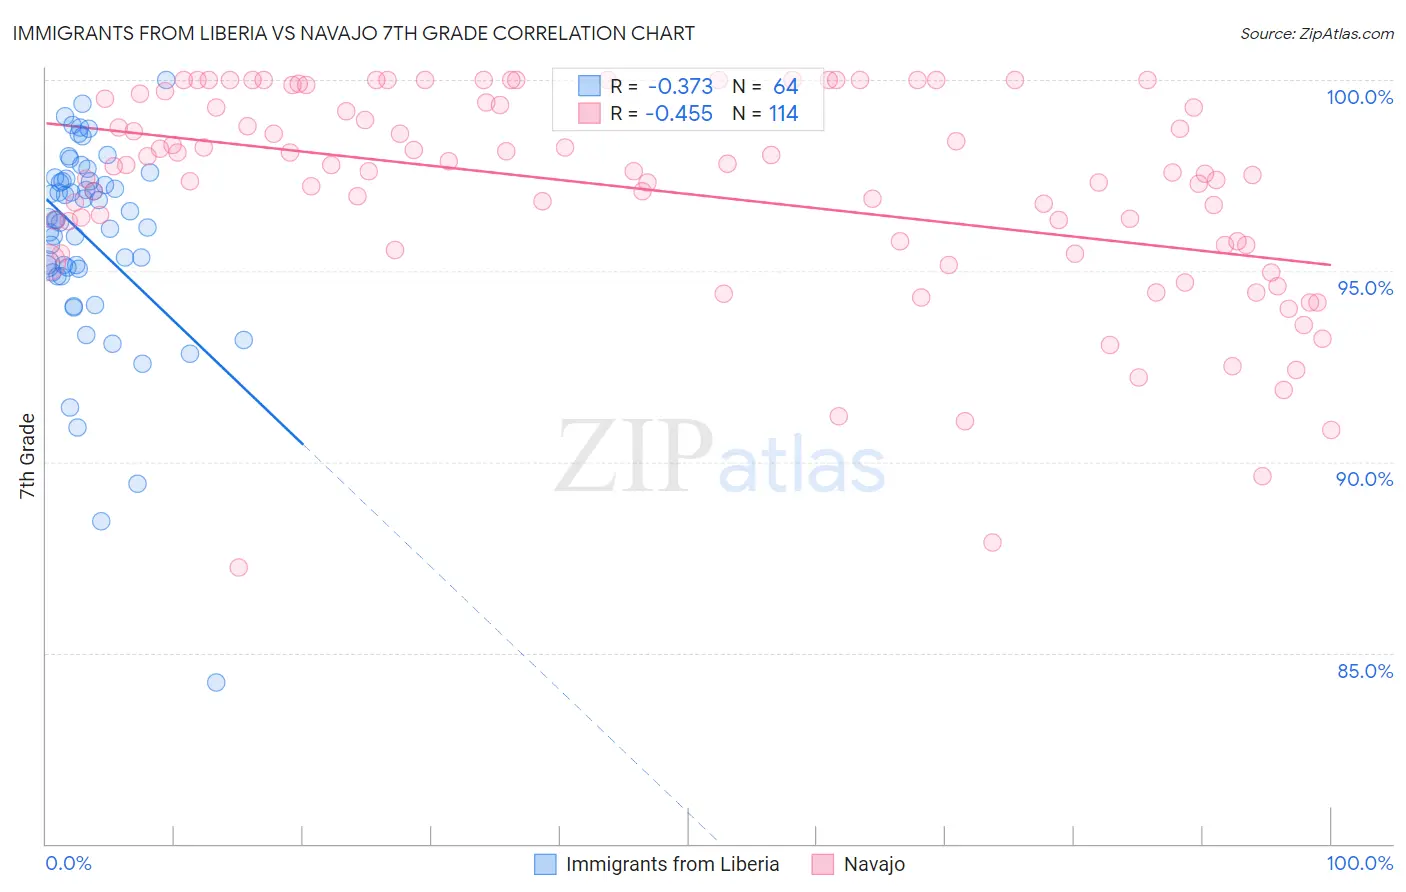
Immigrants from Liberia vs Navajo 7th Grade Correlation Chart
The statistical analysis conducted on geographies consisting of 135,294,272 people shows a mild negative correlation between the proportion of Immigrants from Liberia and percentage of population with at least 7th grade education in the United States with a correlation coefficient (R) of -0.373 and weighted average of 95.7%. Similarly, the statistical analysis conducted on geographies consisting of 224,871,965 people shows a moderate negative correlation between the proportion of Navajo and percentage of population with at least 7th grade education in the United States with a correlation coefficient (R) of -0.455 and weighted average of 95.8%, a difference of 0.13%.
7th Grade Correlation Summary
| Measurement | Immigrants from Liberia | Navajo |
| Minimum | 84.2% | 87.2% |
| Maximum | 100.0% | 100.0% |
| Range | 15.8% | 12.8% |
| Mean | 95.8% | 97.1% |
| Median | 96.3% | 97.6% |
| Interquartile 25% (IQ1) | 95.0% | 95.7% |
| Interquartile 75% (IQ3) | 97.4% | 99.4% |
| Interquartile Range (IQR) | 2.4% | 3.7% |
| Standard Deviation (Sample) | 2.7% | 2.8% |
| Standard Deviation (Population) | 2.7% | 2.8% |
Demographics Similar to Immigrants from Liberia and Navajo by 7th Grade
In terms of 7th grade, the demographic groups most similar to Immigrants from Liberia are Immigrants from Southern Europe (95.7%, a difference of 0.0%), Spanish American (95.7%, a difference of 0.020%), Immigrants from Chile (95.7%, a difference of 0.020%), Immigrants from Pakistan (95.7%, a difference of 0.020%), and Subsaharan African (95.7%, a difference of 0.020%). Similarly, the demographic groups most similar to Navajo are Immigrants from Sudan (95.8%, a difference of 0.0%), African (95.8%, a difference of 0.010%), Dutch West Indian (95.8%, a difference of 0.010%), Hawaiian (95.8%, a difference of 0.010%), and Moroccan (95.8%, a difference of 0.020%).
| Demographics | Rating | Rank | 7th Grade |
| Immigrants | Northern Africa | 21.4 /100 | #202 | Fair 95.8% |
| Comanche | 21.1 /100 | #203 | Fair 95.8% |
| Assyrians/Chaldeans/Syriacs | 20.5 /100 | #204 | Fair 95.8% |
| Moroccans | 18.9 /100 | #205 | Poor 95.8% |
| Africans | 17.6 /100 | #206 | Poor 95.8% |
| Navajo | 17.0 /100 | #207 | Poor 95.8% |
| Immigrants | Sudan | 17.0 /100 | #208 | Poor 95.8% |
| Dutch West Indians | 16.1 /100 | #209 | Poor 95.8% |
| Hawaiians | 16.0 /100 | #210 | Poor 95.8% |
| Portuguese | 13.6 /100 | #211 | Poor 95.8% |
| Immigrants | Lebanon | 13.0 /100 | #212 | Poor 95.8% |
| Immigrants | Morocco | 12.6 /100 | #213 | Poor 95.8% |
| Bahamians | 11.6 /100 | #214 | Poor 95.7% |
| Spanish Americans | 9.3 /100 | #215 | Tragic 95.7% |
| Immigrants | Chile | 9.1 /100 | #216 | Tragic 95.7% |
| Immigrants | Pakistan | 9.0 /100 | #217 | Tragic 95.7% |
| Immigrants | Liberia | 8.1 /100 | #218 | Tragic 95.7% |
| Immigrants | Southern Europe | 7.9 /100 | #219 | Tragic 95.7% |
| Sub-Saharan Africans | 7.2 /100 | #220 | Tragic 95.7% |
| Samoans | 7.0 /100 | #221 | Tragic 95.7% |
| Laotians | 6.8 /100 | #222 | Tragic 95.7% |