Austrian vs Immigrants from Cambodia Master's Degree
COMPARE
Austrian
Immigrants from Cambodia
Master's Degree
Master's Degree Comparison
Austrians
Immigrants from Cambodia
16.7%
MASTER'S DEGREE
97.8/ 100
METRIC RATING
111th/ 347
METRIC RANK
12.9%
MASTER'S DEGREE
1.4/ 100
METRIC RATING
246th/ 347
METRIC RANK
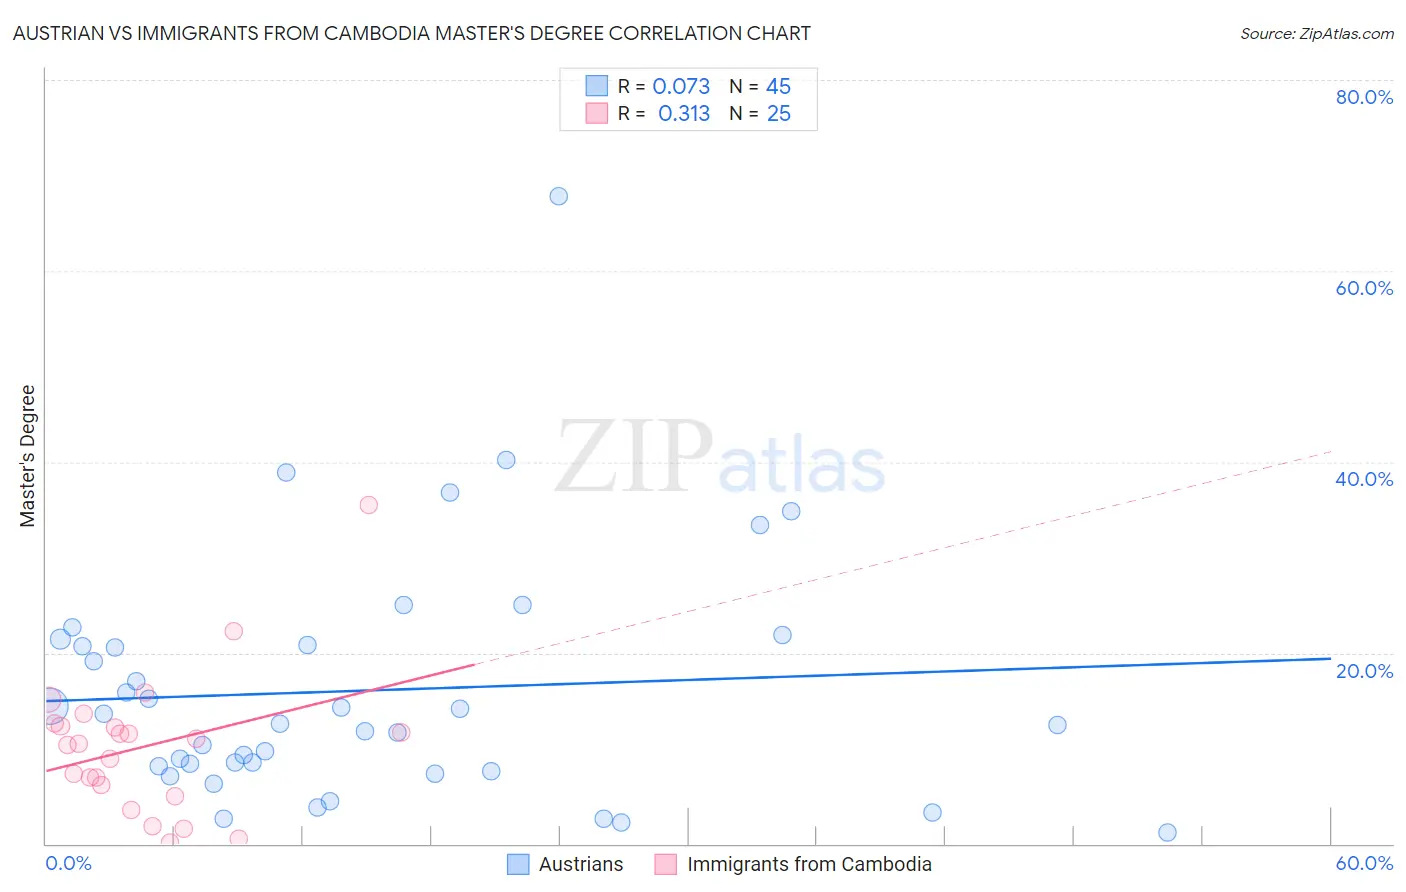
Austrian vs Immigrants from Cambodia Master's Degree Correlation Chart
The statistical analysis conducted on geographies consisting of 451,930,170 people shows a slight positive correlation between the proportion of Austrians and percentage of population with at least master's degree education in the United States with a correlation coefficient (R) of 0.073 and weighted average of 16.7%. Similarly, the statistical analysis conducted on geographies consisting of 205,124,536 people shows a mild positive correlation between the proportion of Immigrants from Cambodia and percentage of population with at least master's degree education in the United States with a correlation coefficient (R) of 0.313 and weighted average of 12.9%, a difference of 29.7%.
Master's Degree Correlation Summary
| Measurement | Austrian | Immigrants from Cambodia |
| Minimum | 1.2% | 0.16% |
| Maximum | 67.9% | 35.5% |
| Range | 66.7% | 35.3% |
| Mean | 16.1% | 10.2% |
| Median | 12.6% | 10.4% |
| Interquartile 25% (IQ1) | 7.9% | 5.6% |
| Interquartile 75% (IQ3) | 21.1% | 12.5% |
| Interquartile Range (IQR) | 13.2% | 6.9% |
| Standard Deviation (Sample) | 12.8% | 7.4% |
| Standard Deviation (Population) | 12.7% | 7.3% |
Similar Demographics by Master's Degree
Demographics Similar to Austrians by Master's Degree
In terms of master's degree, the demographic groups most similar to Austrians are Macedonian (16.7%, a difference of 0.14%), Arab (16.7%, a difference of 0.15%), Northern European (16.7%, a difference of 0.22%), Immigrants from Chile (16.8%, a difference of 0.27%), and Moroccan (16.8%, a difference of 0.30%).
| Demographics | Rating | Rank | Master's Degree |
| Ukrainians | 98.3 /100 | #104 | Exceptional 16.9% |
| Syrians | 98.3 /100 | #105 | Exceptional 16.8% |
| Immigrants | Albania | 98.1 /100 | #106 | Exceptional 16.8% |
| Armenians | 98.0 /100 | #107 | Exceptional 16.8% |
| Sierra Leoneans | 98.0 /100 | #108 | Exceptional 16.8% |
| Moroccans | 98.0 /100 | #109 | Exceptional 16.8% |
| Immigrants | Chile | 98.0 /100 | #110 | Exceptional 16.8% |
| Austrians | 97.8 /100 | #111 | Exceptional 16.7% |
| Macedonians | 97.7 /100 | #112 | Exceptional 16.7% |
| Arabs | 97.7 /100 | #113 | Exceptional 16.7% |
| Northern Europeans | 97.6 /100 | #114 | Exceptional 16.7% |
| Immigrants | Uganda | 97.3 /100 | #115 | Exceptional 16.6% |
| Immigrants | Southern Europe | 97.2 /100 | #116 | Exceptional 16.6% |
| Immigrants | Moldova | 97.2 /100 | #117 | Exceptional 16.6% |
| Brazilians | 96.8 /100 | #118 | Exceptional 16.5% |
Demographics Similar to Immigrants from Cambodia by Master's Degree
In terms of master's degree, the demographic groups most similar to Immigrants from Cambodia are Iroquois (12.9%, a difference of 0.030%), Immigrants from Bahamas (12.9%, a difference of 0.040%), African (12.9%, a difference of 0.12%), Cree (12.8%, a difference of 0.43%), and Liberian (12.8%, a difference of 0.44%).
| Demographics | Rating | Rank | Master's Degree |
| Immigrants | Nonimmigrants | 3.4 /100 | #239 | Tragic 13.3% |
| Guamanians/Chamorros | 2.2 /100 | #240 | Tragic 13.1% |
| U.S. Virgin Islanders | 2.1 /100 | #241 | Tragic 13.1% |
| Spanish Americans | 1.9 /100 | #242 | Tragic 13.0% |
| Immigrants | Jamaica | 1.9 /100 | #243 | Tragic 13.0% |
| Delaware | 1.7 /100 | #244 | Tragic 13.0% |
| Immigrants | Bahamas | 1.4 /100 | #245 | Tragic 12.9% |
| Immigrants | Cambodia | 1.4 /100 | #246 | Tragic 12.9% |
| Iroquois | 1.4 /100 | #247 | Tragic 12.9% |
| Africans | 1.4 /100 | #248 | Tragic 12.9% |
| Cree | 1.3 /100 | #249 | Tragic 12.8% |
| Liberians | 1.3 /100 | #250 | Tragic 12.8% |
| Tlingit-Haida | 1.3 /100 | #251 | Tragic 12.8% |
| French American Indians | 1.0 /100 | #252 | Tragic 12.7% |
| Immigrants | Dominica | 0.8 /100 | #253 | Tragic 12.6% |