Austrian vs Japanese 8th Grade
COMPARE
Austrian
Japanese
8th Grade
8th Grade Comparison
Austrians
Japanese
96.7%
8TH GRADE
99.9/ 100
METRIC RATING
53rd/ 347
METRIC RANK
93.6%
8TH GRADE
0.0/ 100
METRIC RATING
310th/ 347
METRIC RANK
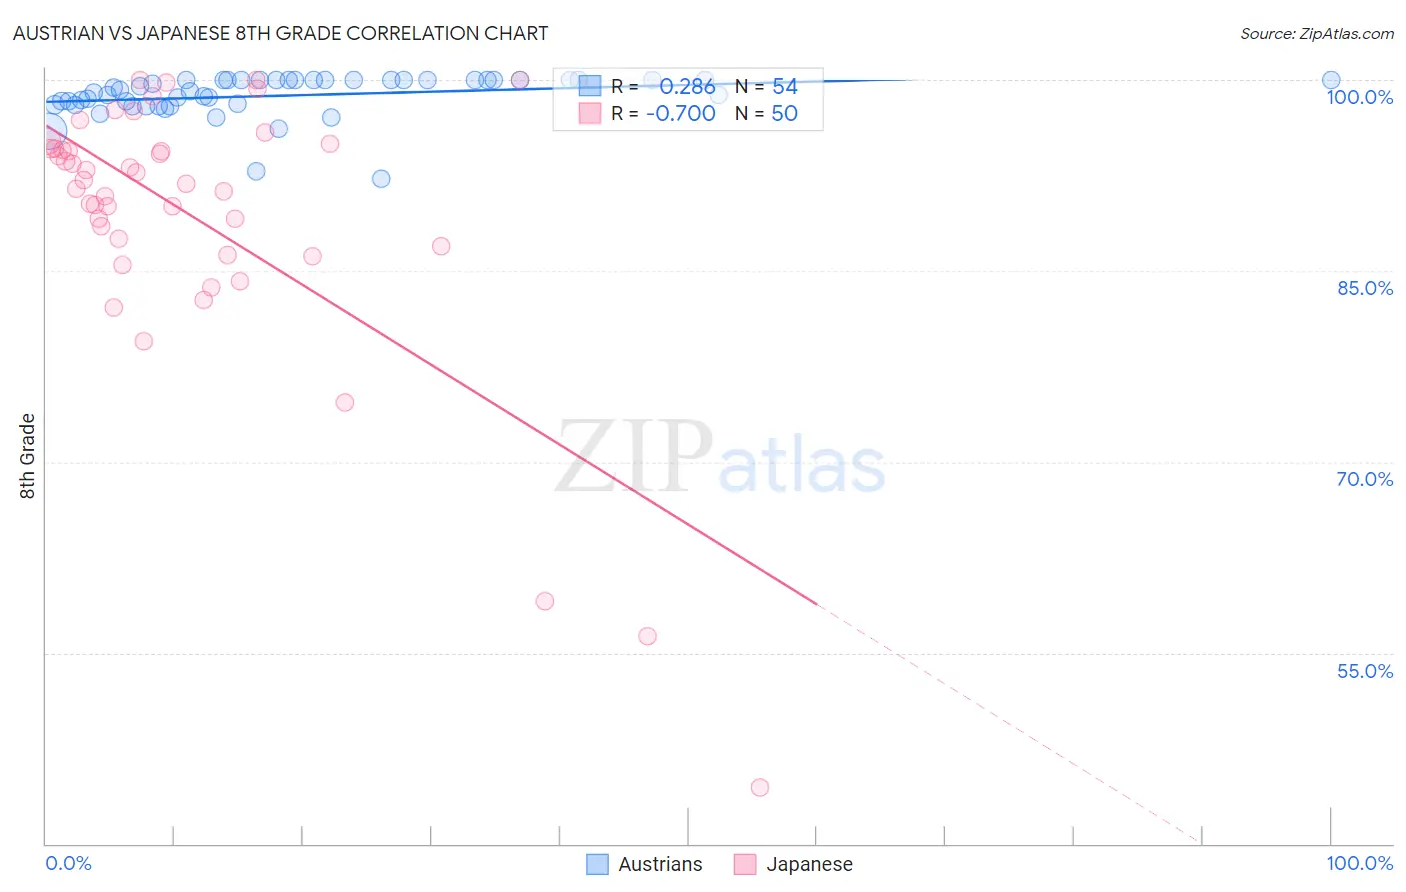
Austrian vs Japanese 8th Grade Correlation Chart
The statistical analysis conducted on geographies consisting of 452,083,231 people shows a weak positive correlation between the proportion of Austrians and percentage of population with at least 8th grade education in the United States with a correlation coefficient (R) of 0.286 and weighted average of 96.7%. Similarly, the statistical analysis conducted on geographies consisting of 249,183,224 people shows a strong negative correlation between the proportion of Japanese and percentage of population with at least 8th grade education in the United States with a correlation coefficient (R) of -0.700 and weighted average of 93.6%, a difference of 3.4%.
8th Grade Correlation Summary
| Measurement | Austrian | Japanese |
| Minimum | 92.3% | 44.4% |
| Maximum | 100.0% | 100.0% |
| Range | 7.7% | 55.6% |
| Mean | 98.8% | 89.3% |
| Median | 99.2% | 92.0% |
| Interquartile 25% (IQ1) | 98.1% | 86.9% |
| Interquartile 75% (IQ3) | 100.0% | 94.6% |
| Interquartile Range (IQR) | 1.9% | 7.8% |
| Standard Deviation (Sample) | 1.6% | 10.8% |
| Standard Deviation (Population) | 1.6% | 10.7% |
Similar Demographics by 8th Grade
Demographics Similar to Austrians by 8th Grade
In terms of 8th grade, the demographic groups most similar to Austrians are Serbian (96.7%, a difference of 0.010%), Russian (96.7%, a difference of 0.010%), Australian (96.7%, a difference of 0.010%), Macedonian (96.7%, a difference of 0.010%), and Greek (96.8%, a difference of 0.020%).
| Demographics | Rating | Rank | 8th Grade |
| Czechoslovakians | 99.9 /100 | #46 | Exceptional 96.9% |
| Bulgarians | 99.9 /100 | #47 | Exceptional 96.9% |
| Slavs | 99.9 /100 | #48 | Exceptional 96.8% |
| Estonians | 99.9 /100 | #49 | Exceptional 96.8% |
| Immigrants | Scotland | 99.9 /100 | #50 | Exceptional 96.8% |
| Celtics | 99.9 /100 | #51 | Exceptional 96.8% |
| Greeks | 99.9 /100 | #52 | Exceptional 96.8% |
| Austrians | 99.9 /100 | #53 | Exceptional 96.7% |
| Serbians | 99.8 /100 | #54 | Exceptional 96.7% |
| Russians | 99.8 /100 | #55 | Exceptional 96.7% |
| Australians | 99.8 /100 | #56 | Exceptional 96.7% |
| Macedonians | 99.8 /100 | #57 | Exceptional 96.7% |
| Immigrants | Canada | 99.8 /100 | #58 | Exceptional 96.7% |
| Immigrants | North America | 99.8 /100 | #59 | Exceptional 96.7% |
| Immigrants | Northern Europe | 99.8 /100 | #60 | Exceptional 96.7% |
Demographics Similar to Japanese by 8th Grade
In terms of 8th grade, the demographic groups most similar to Japanese are Immigrants (93.6%, a difference of 0.0%), Immigrants from Bangladesh (93.6%, a difference of 0.0%), Ecuadorian (93.6%, a difference of 0.030%), Cape Verdean (93.5%, a difference of 0.040%), and Immigrants from Caribbean (93.5%, a difference of 0.070%).
| Demographics | Rating | Rank | 8th Grade |
| Immigrants | Dominica | 0.0 /100 | #303 | Tragic 94.0% |
| Guyanese | 0.0 /100 | #304 | Tragic 93.9% |
| Immigrants | Haiti | 0.0 /100 | #305 | Tragic 93.9% |
| Immigrants | Guyana | 0.0 /100 | #306 | Tragic 93.8% |
| Immigrants | Portugal | 0.0 /100 | #307 | Tragic 93.8% |
| Ecuadorians | 0.0 /100 | #308 | Tragic 93.6% |
| Immigrants | Immigrants | 0.0 /100 | #309 | Tragic 93.6% |
| Japanese | 0.0 /100 | #310 | Tragic 93.6% |
| Immigrants | Bangladesh | 0.0 /100 | #311 | Tragic 93.6% |
| Cape Verdeans | 0.0 /100 | #312 | Tragic 93.5% |
| Immigrants | Caribbean | 0.0 /100 | #313 | Tragic 93.5% |
| Immigrants | Vietnam | 0.0 /100 | #314 | Tragic 93.5% |
| Vietnamese | 0.0 /100 | #315 | Tragic 93.5% |
| Immigrants | Cambodia | 0.0 /100 | #316 | Tragic 93.3% |
| Immigrants | Ecuador | 0.0 /100 | #317 | Tragic 93.3% |