Australian vs Cypriot 2nd Grade
COMPARE
Australian
Cypriot
2nd Grade
2nd Grade Comparison
Australians
Cypriots
98.4%
2ND GRADE
99.8/ 100
METRIC RATING
52nd/ 347
METRIC RANK
98.2%
2ND GRADE
98.4/ 100
METRIC RATING
96th/ 347
METRIC RANK
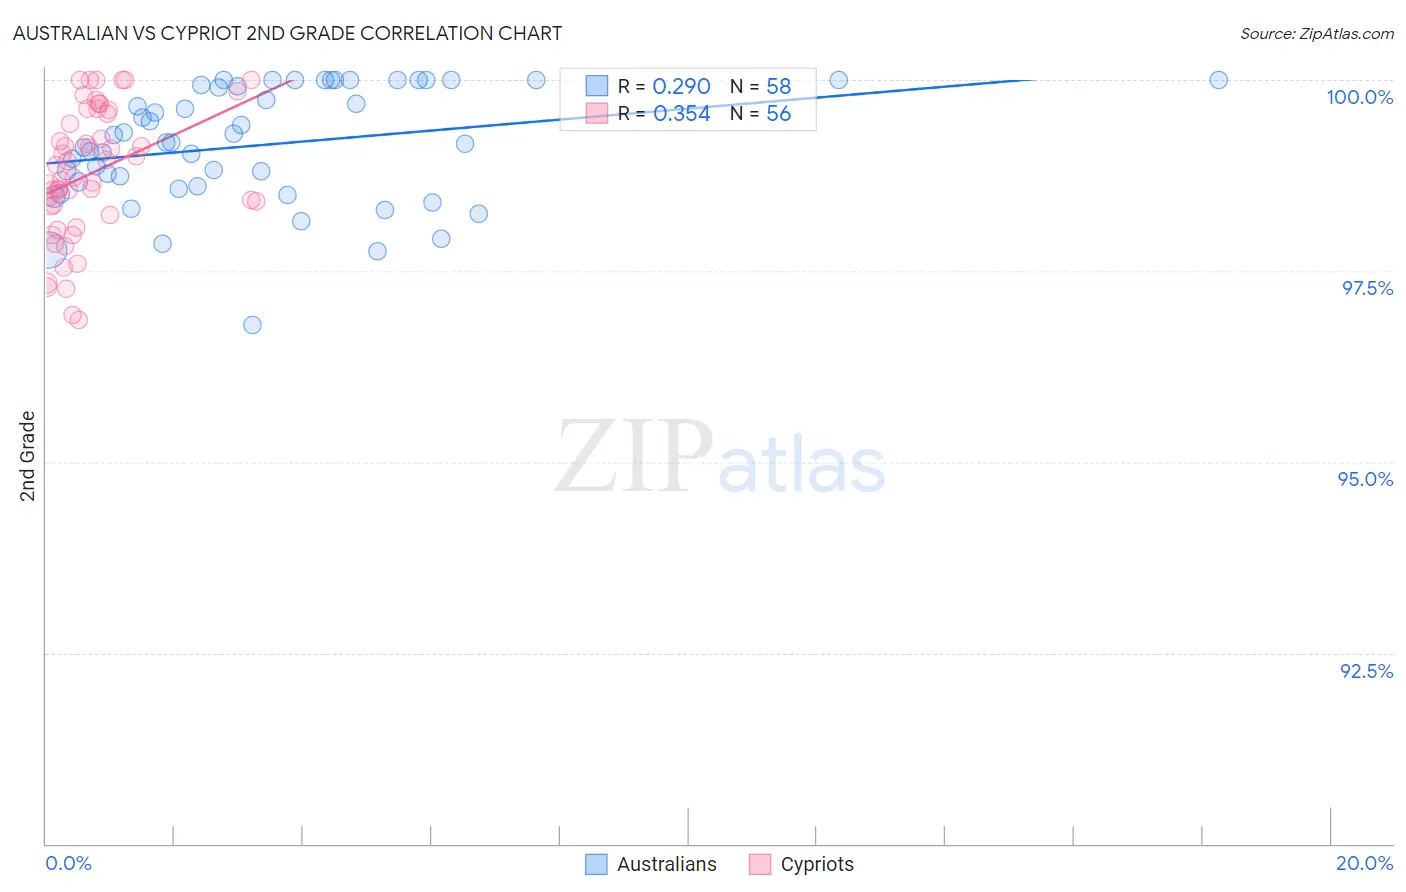
Australian vs Cypriot 2nd Grade Correlation Chart
The statistical analysis conducted on geographies consisting of 224,153,392 people shows a weak positive correlation between the proportion of Australians and percentage of population with at least 2nd grade education in the United States with a correlation coefficient (R) of 0.290 and weighted average of 98.4%. Similarly, the statistical analysis conducted on geographies consisting of 61,867,249 people shows a mild positive correlation between the proportion of Cypriots and percentage of population with at least 2nd grade education in the United States with a correlation coefficient (R) of 0.354 and weighted average of 98.2%, a difference of 0.17%.
2nd Grade Correlation Summary
| Measurement | Australian | Cypriot |
| Minimum | 96.8% | 96.9% |
| Maximum | 100.0% | 100.0% |
| Range | 3.2% | 3.1% |
| Mean | 99.2% | 98.8% |
| Median | 99.2% | 98.8% |
| Interquartile 25% (IQ1) | 98.6% | 98.3% |
| Interquartile 75% (IQ3) | 99.9% | 99.6% |
| Interquartile Range (IQR) | 1.3% | 1.3% |
| Standard Deviation (Sample) | 0.76% | 0.85% |
| Standard Deviation (Population) | 0.75% | 0.85% |
Similar Demographics by 2nd Grade
Demographics Similar to Australians by 2nd Grade
In terms of 2nd grade, the demographic groups most similar to Australians are Celtic (98.4%, a difference of 0.0%), White/Caucasian (98.4%, a difference of 0.0%), Estonian (98.4%, a difference of 0.0%), Pueblo (98.3%, a difference of 0.010%), and Kiowa (98.3%, a difference of 0.010%).
| Demographics | Rating | Rank | 2nd Grade |
| Hungarians | 99.9 /100 | #45 | Exceptional 98.4% |
| Lumbee | 99.9 /100 | #46 | Exceptional 98.4% |
| Ottawa | 99.9 /100 | #47 | Exceptional 98.4% |
| Czechoslovakians | 99.9 /100 | #48 | Exceptional 98.4% |
| Celtics | 99.8 /100 | #49 | Exceptional 98.4% |
| Whites/Caucasians | 99.8 /100 | #50 | Exceptional 98.4% |
| Estonians | 99.8 /100 | #51 | Exceptional 98.4% |
| Australians | 99.8 /100 | #52 | Exceptional 98.4% |
| Pueblo | 99.8 /100 | #53 | Exceptional 98.3% |
| Kiowa | 99.8 /100 | #54 | Exceptional 98.3% |
| Immigrants | Scotland | 99.8 /100 | #55 | Exceptional 98.3% |
| Americans | 99.8 /100 | #56 | Exceptional 98.3% |
| Austrians | 99.8 /100 | #57 | Exceptional 98.3% |
| Bulgarians | 99.8 /100 | #58 | Exceptional 98.3% |
| Slavs | 99.8 /100 | #59 | Exceptional 98.3% |
Demographics Similar to Cypriots by 2nd Grade
In terms of 2nd grade, the demographic groups most similar to Cypriots are Immigrants from Germany (98.2%, a difference of 0.010%), South African (98.2%, a difference of 0.010%), Choctaw (98.2%, a difference of 0.010%), Nonimmigrants (98.2%, a difference of 0.010%), and Zimbabwean (98.2%, a difference of 0.020%).
| Demographics | Rating | Rank | 2nd Grade |
| Ukrainians | 98.9 /100 | #89 | Exceptional 98.2% |
| Zimbabweans | 98.8 /100 | #90 | Exceptional 98.2% |
| Immigrants | Western Europe | 98.8 /100 | #91 | Exceptional 98.2% |
| Immigrants | South Africa | 98.8 /100 | #92 | Exceptional 98.2% |
| Immigrants | India | 98.8 /100 | #93 | Exceptional 98.2% |
| Immigrants | Germany | 98.6 /100 | #94 | Exceptional 98.2% |
| South Africans | 98.6 /100 | #95 | Exceptional 98.2% |
| Cypriots | 98.4 /100 | #96 | Exceptional 98.2% |
| Choctaw | 98.3 /100 | #97 | Exceptional 98.2% |
| Immigrants | Nonimmigrants | 98.3 /100 | #98 | Exceptional 98.2% |
| Immigrants | Ireland | 98.0 /100 | #99 | Exceptional 98.2% |
| Romanians | 98.0 /100 | #100 | Exceptional 98.2% |
| Puget Sound Salish | 98.0 /100 | #101 | Exceptional 98.2% |
| Cree | 98.0 /100 | #102 | Exceptional 98.2% |
| Pima | 97.6 /100 | #103 | Exceptional 98.2% |