Immigrants from Oceania vs Immigrants from Sierra Leone 8th Grade
COMPARE
Immigrants from Oceania
Immigrants from Sierra Leone
8th Grade
8th Grade Comparison
Immigrants from Oceania
Immigrants from Sierra Leone
95.3%
8TH GRADE
7.1/ 100
METRIC RATING
223rd/ 347
METRIC RANK
95.1%
8TH GRADE
2.1/ 100
METRIC RATING
239th/ 347
METRIC RANK
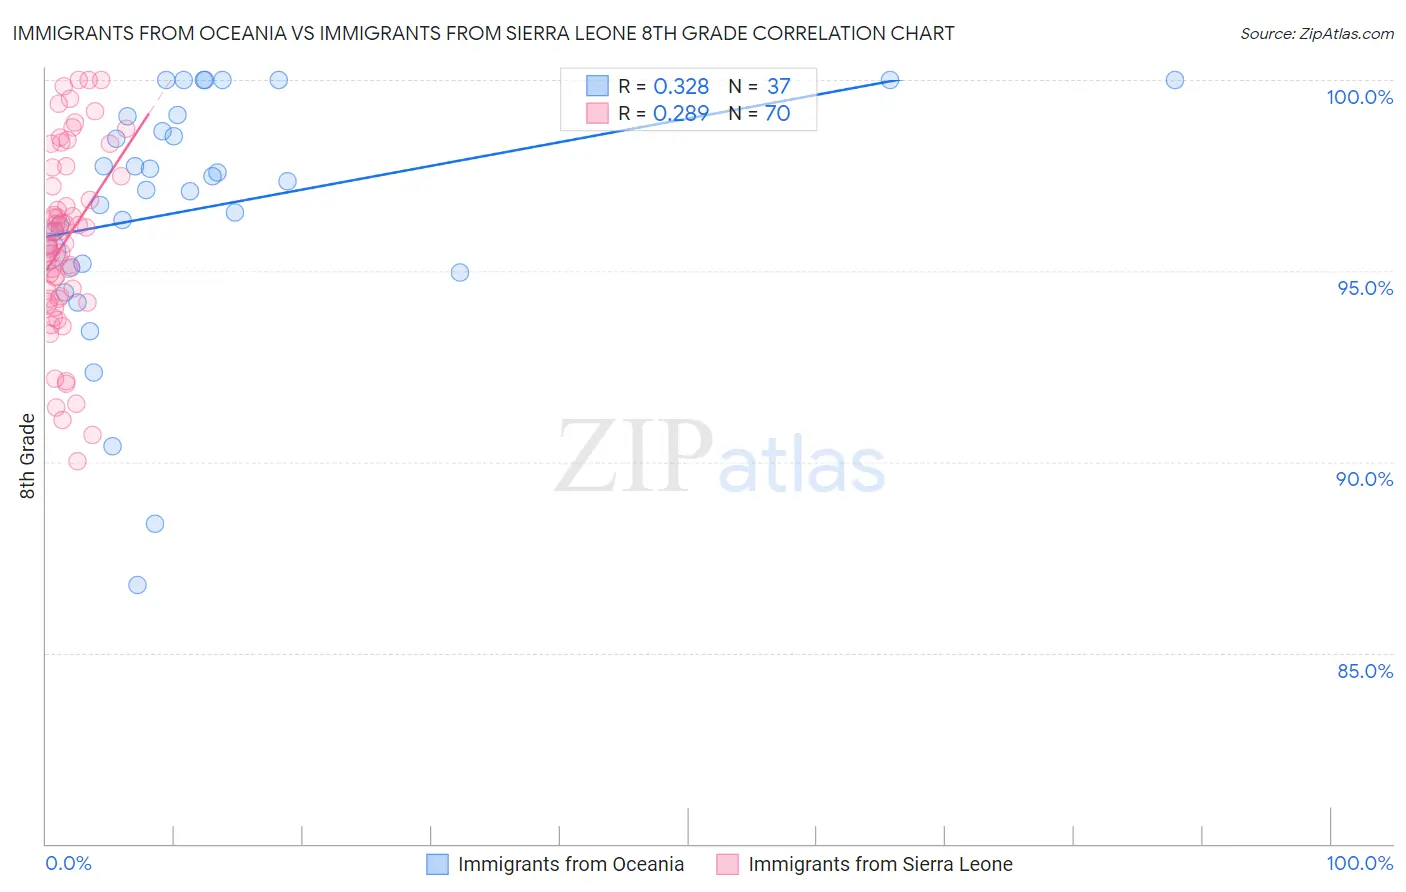
Immigrants from Oceania vs Immigrants from Sierra Leone 8th Grade Correlation Chart
The statistical analysis conducted on geographies consisting of 305,521,521 people shows a mild positive correlation between the proportion of Immigrants from Oceania and percentage of population with at least 8th grade education in the United States with a correlation coefficient (R) of 0.328 and weighted average of 95.3%. Similarly, the statistical analysis conducted on geographies consisting of 101,634,956 people shows a weak positive correlation between the proportion of Immigrants from Sierra Leone and percentage of population with at least 8th grade education in the United States with a correlation coefficient (R) of 0.289 and weighted average of 95.1%, a difference of 0.21%.
8th Grade Correlation Summary
| Measurement | Immigrants from Oceania | Immigrants from Sierra Leone |
| Minimum | 86.8% | 90.0% |
| Maximum | 100.0% | 100.0% |
| Range | 13.2% | 10.0% |
| Mean | 96.6% | 95.8% |
| Median | 97.3% | 95.7% |
| Interquartile 25% (IQ1) | 95.1% | 94.3% |
| Interquartile 75% (IQ3) | 99.1% | 97.5% |
| Interquartile Range (IQR) | 3.9% | 3.2% |
| Standard Deviation (Sample) | 3.2% | 2.4% |
| Standard Deviation (Population) | 3.2% | 2.4% |
Demographics Similar to Immigrants from Oceania and Immigrants from Sierra Leone by 8th Grade
In terms of 8th grade, the demographic groups most similar to Immigrants from Oceania are Immigrants from Malaysia (95.3%, a difference of 0.0%), Immigrants from Syria (95.3%, a difference of 0.010%), Immigrants from Western Asia (95.3%, a difference of 0.030%), Subsaharan African (95.3%, a difference of 0.030%), and Navajo (95.3%, a difference of 0.040%). Similarly, the demographic groups most similar to Immigrants from Sierra Leone are Ethiopian (95.1%, a difference of 0.0%), South American Indian (95.1%, a difference of 0.010%), Native/Alaskan (95.2%, a difference of 0.020%), Senegalese (95.2%, a difference of 0.040%), and Immigrants from Africa (95.2%, a difference of 0.040%).
| Demographics | Rating | Rank | 8th Grade |
| Immigrants | Syria | 7.4 /100 | #221 | Tragic 95.3% |
| Immigrants | Malaysia | 7.3 /100 | #222 | Tragic 95.3% |
| Immigrants | Oceania | 7.1 /100 | #223 | Tragic 95.3% |
| Immigrants | Western Asia | 6.0 /100 | #224 | Tragic 95.3% |
| Sub-Saharan Africans | 6.0 /100 | #225 | Tragic 95.3% |
| Navajo | 5.7 /100 | #226 | Tragic 95.3% |
| Bahamians | 5.6 /100 | #227 | Tragic 95.3% |
| Immigrants | Eastern Africa | 5.6 /100 | #228 | Tragic 95.3% |
| Immigrants | Indonesia | 4.4 /100 | #229 | Tragic 95.3% |
| Immigrants | Panama | 4.1 /100 | #230 | Tragic 95.2% |
| Asians | 3.5 /100 | #231 | Tragic 95.2% |
| Indians (Asian) | 3.3 /100 | #232 | Tragic 95.2% |
| Immigrants | Asia | 3.1 /100 | #233 | Tragic 95.2% |
| Costa Ricans | 3.0 /100 | #234 | Tragic 95.2% |
| Nigerians | 2.9 /100 | #235 | Tragic 95.2% |
| Senegalese | 2.7 /100 | #236 | Tragic 95.2% |
| Immigrants | Africa | 2.7 /100 | #237 | Tragic 95.2% |
| Natives/Alaskans | 2.3 /100 | #238 | Tragic 95.2% |
| Immigrants | Sierra Leone | 2.1 /100 | #239 | Tragic 95.1% |
| Ethiopians | 2.0 /100 | #240 | Tragic 95.1% |
| South American Indians | 1.9 /100 | #241 | Tragic 95.1% |