Assyrian/Chaldean/Syriac vs U.S. Virgin Islander 7th Grade
COMPARE
Assyrian/Chaldean/Syriac
U.S. Virgin Islander
7th Grade
7th Grade Comparison
Assyrians/Chaldeans/Syriacs
U.S. Virgin Islanders
95.8%
7TH GRADE
20.5/ 100
METRIC RATING
204th/ 347
METRIC RANK
95.4%
7TH GRADE
1.6/ 100
METRIC RATING
243rd/ 347
METRIC RANK
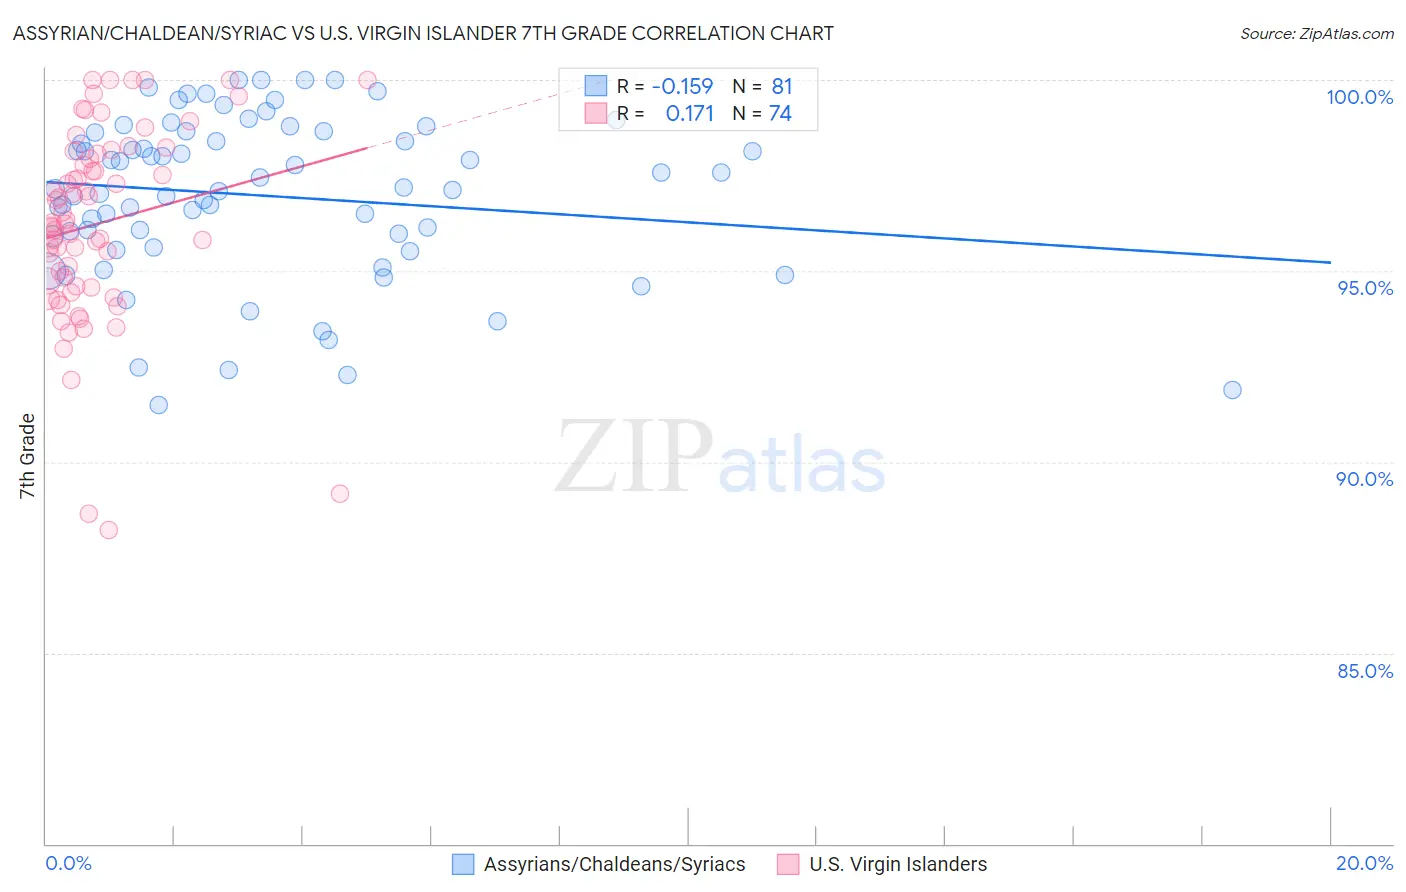
Assyrian/Chaldean/Syriac vs U.S. Virgin Islander 7th Grade Correlation Chart
The statistical analysis conducted on geographies consisting of 110,318,304 people shows a poor negative correlation between the proportion of Assyrians/Chaldeans/Syriacs and percentage of population with at least 7th grade education in the United States with a correlation coefficient (R) of -0.159 and weighted average of 95.8%. Similarly, the statistical analysis conducted on geographies consisting of 87,529,315 people shows a poor positive correlation between the proportion of U.S. Virgin Islanders and percentage of population with at least 7th grade education in the United States with a correlation coefficient (R) of 0.171 and weighted average of 95.4%, a difference of 0.42%.
7th Grade Correlation Summary
| Measurement | Assyrian/Chaldean/Syriac | U.S. Virgin Islander |
| Minimum | 91.5% | 88.2% |
| Maximum | 100.0% | 100.0% |
| Range | 8.5% | 11.8% |
| Mean | 97.0% | 96.2% |
| Median | 97.1% | 96.2% |
| Interquartile 25% (IQ1) | 95.8% | 94.6% |
| Interquartile 75% (IQ3) | 98.7% | 98.1% |
| Interquartile Range (IQR) | 2.9% | 3.5% |
| Standard Deviation (Sample) | 2.1% | 2.5% |
| Standard Deviation (Population) | 2.1% | 2.5% |
Similar Demographics by 7th Grade
Demographics Similar to Assyrians/Chaldeans/Syriacs by 7th Grade
In terms of 7th grade, the demographic groups most similar to Assyrians/Chaldeans/Syriacs are Immigrants from Argentina (95.9%, a difference of 0.010%), Immigrants from Northern Africa (95.8%, a difference of 0.010%), Comanche (95.8%, a difference of 0.010%), Argentinean (95.9%, a difference of 0.020%), and Moroccan (95.8%, a difference of 0.020%).
| Demographics | Rating | Rank | 7th Grade |
| Immigrants | Zaire | 26.7 /100 | #197 | Fair 95.9% |
| Paraguayans | 24.8 /100 | #198 | Fair 95.9% |
| Guamanians/Chamorros | 23.5 /100 | #199 | Fair 95.9% |
| Argentineans | 23.2 /100 | #200 | Fair 95.9% |
| Immigrants | Argentina | 21.9 /100 | #201 | Fair 95.9% |
| Immigrants | Northern Africa | 21.4 /100 | #202 | Fair 95.8% |
| Comanche | 21.1 /100 | #203 | Fair 95.8% |
| Assyrians/Chaldeans/Syriacs | 20.5 /100 | #204 | Fair 95.8% |
| Moroccans | 18.9 /100 | #205 | Poor 95.8% |
| Africans | 17.6 /100 | #206 | Poor 95.8% |
| Navajo | 17.0 /100 | #207 | Poor 95.8% |
| Immigrants | Sudan | 17.0 /100 | #208 | Poor 95.8% |
| Dutch West Indians | 16.1 /100 | #209 | Poor 95.8% |
| Hawaiians | 16.0 /100 | #210 | Poor 95.8% |
| Portuguese | 13.6 /100 | #211 | Poor 95.8% |
Demographics Similar to U.S. Virgin Islanders by 7th Grade
In terms of 7th grade, the demographic groups most similar to U.S. Virgin Islanders are Uruguayan (95.4%, a difference of 0.0%), Immigrants from Middle Africa (95.4%, a difference of 0.010%), Immigrants from Senegal (95.5%, a difference of 0.020%), Ethiopian (95.4%, a difference of 0.020%), and Immigrants from Sierra Leone (95.5%, a difference of 0.030%).
| Demographics | Rating | Rank | 7th Grade |
| Asians | 2.6 /100 | #236 | Tragic 95.5% |
| Immigrants | Asia | 2.3 /100 | #237 | Tragic 95.5% |
| Indians (Asian) | 2.3 /100 | #238 | Tragic 95.5% |
| Jamaicans | 2.2 /100 | #239 | Tragic 95.5% |
| Immigrants | Sierra Leone | 2.0 /100 | #240 | Tragic 95.5% |
| South American Indians | 2.0 /100 | #241 | Tragic 95.5% |
| Immigrants | Senegal | 1.9 /100 | #242 | Tragic 95.5% |
| U.S. Virgin Islanders | 1.6 /100 | #243 | Tragic 95.4% |
| Uruguayans | 1.6 /100 | #244 | Tragic 95.4% |
| Immigrants | Middle Africa | 1.5 /100 | #245 | Tragic 95.4% |
| Ethiopians | 1.5 /100 | #246 | Tragic 95.4% |
| Tongans | 1.3 /100 | #247 | Tragic 95.4% |
| Paiute | 1.2 /100 | #248 | Tragic 95.4% |
| Bolivians | 1.1 /100 | #249 | Tragic 95.4% |
| Immigrants | Cameroon | 0.9 /100 | #250 | Tragic 95.4% |