Icelander vs U.S. Virgin Islander 7th Grade
COMPARE
Icelander
U.S. Virgin Islander
7th Grade
7th Grade Comparison
Icelanders
U.S. Virgin Islanders
96.7%
7TH GRADE
99.1/ 100
METRIC RATING
83rd/ 347
METRIC RANK
95.4%
7TH GRADE
1.6/ 100
METRIC RATING
243rd/ 347
METRIC RANK
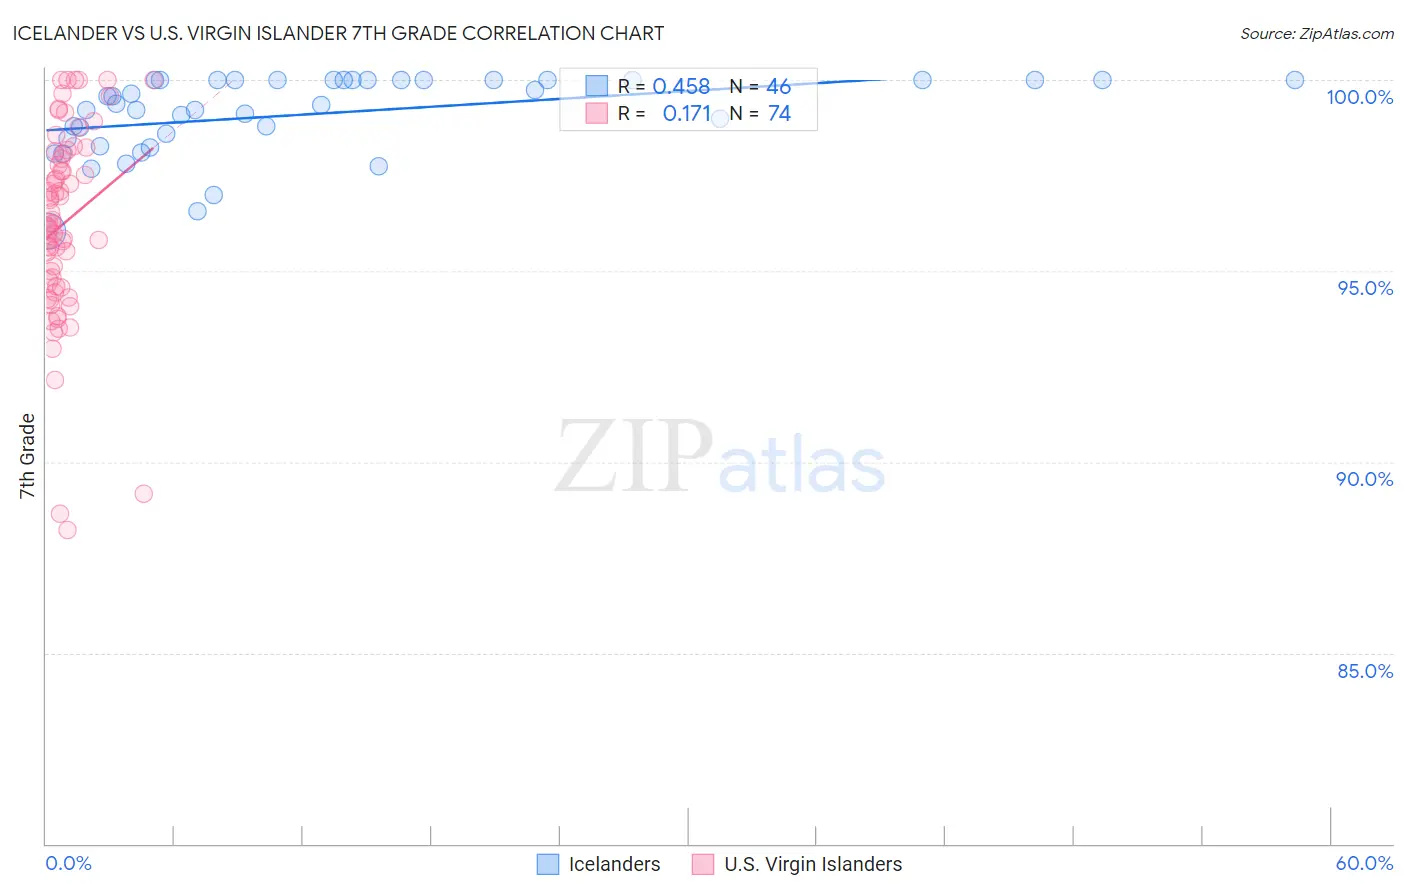
Icelander vs U.S. Virgin Islander 7th Grade Correlation Chart
The statistical analysis conducted on geographies consisting of 159,668,975 people shows a moderate positive correlation between the proportion of Icelanders and percentage of population with at least 7th grade education in the United States with a correlation coefficient (R) of 0.458 and weighted average of 96.7%. Similarly, the statistical analysis conducted on geographies consisting of 87,529,315 people shows a poor positive correlation between the proportion of U.S. Virgin Islanders and percentage of population with at least 7th grade education in the United States with a correlation coefficient (R) of 0.171 and weighted average of 95.4%, a difference of 1.4%.
7th Grade Correlation Summary
| Measurement | Icelander | U.S. Virgin Islander |
| Minimum | 96.0% | 88.2% |
| Maximum | 100.0% | 100.0% |
| Range | 4.0% | 11.8% |
| Mean | 99.1% | 96.2% |
| Median | 99.4% | 96.2% |
| Interquartile 25% (IQ1) | 98.5% | 94.6% |
| Interquartile 75% (IQ3) | 100.0% | 98.1% |
| Interquartile Range (IQR) | 1.5% | 3.5% |
| Standard Deviation (Sample) | 1.0% | 2.5% |
| Standard Deviation (Population) | 1.0% | 2.5% |
Similar Demographics by 7th Grade
Demographics Similar to Icelanders by 7th Grade
In terms of 7th grade, the demographic groups most similar to Icelanders are Romanian (96.7%, a difference of 0.0%), Delaware (96.8%, a difference of 0.010%), Chickasaw (96.7%, a difference of 0.010%), Kiowa (96.7%, a difference of 0.010%), and Turkish (96.7%, a difference of 0.010%).
| Demographics | Rating | Rank | 7th Grade |
| Immigrants | Ireland | 99.4 /100 | #76 | Exceptional 96.8% |
| Cherokee | 99.4 /100 | #77 | Exceptional 96.8% |
| Immigrants | Netherlands | 99.3 /100 | #78 | Exceptional 96.8% |
| Cypriots | 99.3 /100 | #79 | Exceptional 96.8% |
| Yugoslavians | 99.3 /100 | #80 | Exceptional 96.8% |
| Delaware | 99.2 /100 | #81 | Exceptional 96.8% |
| Chickasaw | 99.2 /100 | #82 | Exceptional 96.7% |
| Icelanders | 99.1 /100 | #83 | Exceptional 96.7% |
| Romanians | 99.1 /100 | #84 | Exceptional 96.7% |
| Kiowa | 99.1 /100 | #85 | Exceptional 96.7% |
| Turks | 99.1 /100 | #86 | Exceptional 96.7% |
| Immigrants | Belgium | 99.0 /100 | #87 | Exceptional 96.7% |
| Puget Sound Salish | 99.0 /100 | #88 | Exceptional 96.7% |
| Cree | 99.0 /100 | #89 | Exceptional 96.7% |
| Immigrants | South Africa | 98.9 /100 | #90 | Exceptional 96.7% |
Demographics Similar to U.S. Virgin Islanders by 7th Grade
In terms of 7th grade, the demographic groups most similar to U.S. Virgin Islanders are Uruguayan (95.4%, a difference of 0.0%), Immigrants from Middle Africa (95.4%, a difference of 0.010%), Immigrants from Senegal (95.5%, a difference of 0.020%), Ethiopian (95.4%, a difference of 0.020%), and Immigrants from Sierra Leone (95.5%, a difference of 0.030%).
| Demographics | Rating | Rank | 7th Grade |
| Asians | 2.6 /100 | #236 | Tragic 95.5% |
| Immigrants | Asia | 2.3 /100 | #237 | Tragic 95.5% |
| Indians (Asian) | 2.3 /100 | #238 | Tragic 95.5% |
| Jamaicans | 2.2 /100 | #239 | Tragic 95.5% |
| Immigrants | Sierra Leone | 2.0 /100 | #240 | Tragic 95.5% |
| South American Indians | 2.0 /100 | #241 | Tragic 95.5% |
| Immigrants | Senegal | 1.9 /100 | #242 | Tragic 95.5% |
| U.S. Virgin Islanders | 1.6 /100 | #243 | Tragic 95.4% |
| Uruguayans | 1.6 /100 | #244 | Tragic 95.4% |
| Immigrants | Middle Africa | 1.5 /100 | #245 | Tragic 95.4% |
| Ethiopians | 1.5 /100 | #246 | Tragic 95.4% |
| Tongans | 1.3 /100 | #247 | Tragic 95.4% |
| Paiute | 1.2 /100 | #248 | Tragic 95.4% |
| Bolivians | 1.1 /100 | #249 | Tragic 95.4% |
| Immigrants | Cameroon | 0.9 /100 | #250 | Tragic 95.4% |