Assyrian/Chaldean/Syriac vs Colville 7th Grade
COMPARE
Assyrian/Chaldean/Syriac
Colville
7th Grade
7th Grade Comparison
Assyrians/Chaldeans/Syriacs
Colville
95.8%
7TH GRADE
20.5/ 100
METRIC RATING
204th/ 347
METRIC RANK
96.4%
7TH GRADE
91.7/ 100
METRIC RATING
132nd/ 347
METRIC RANK
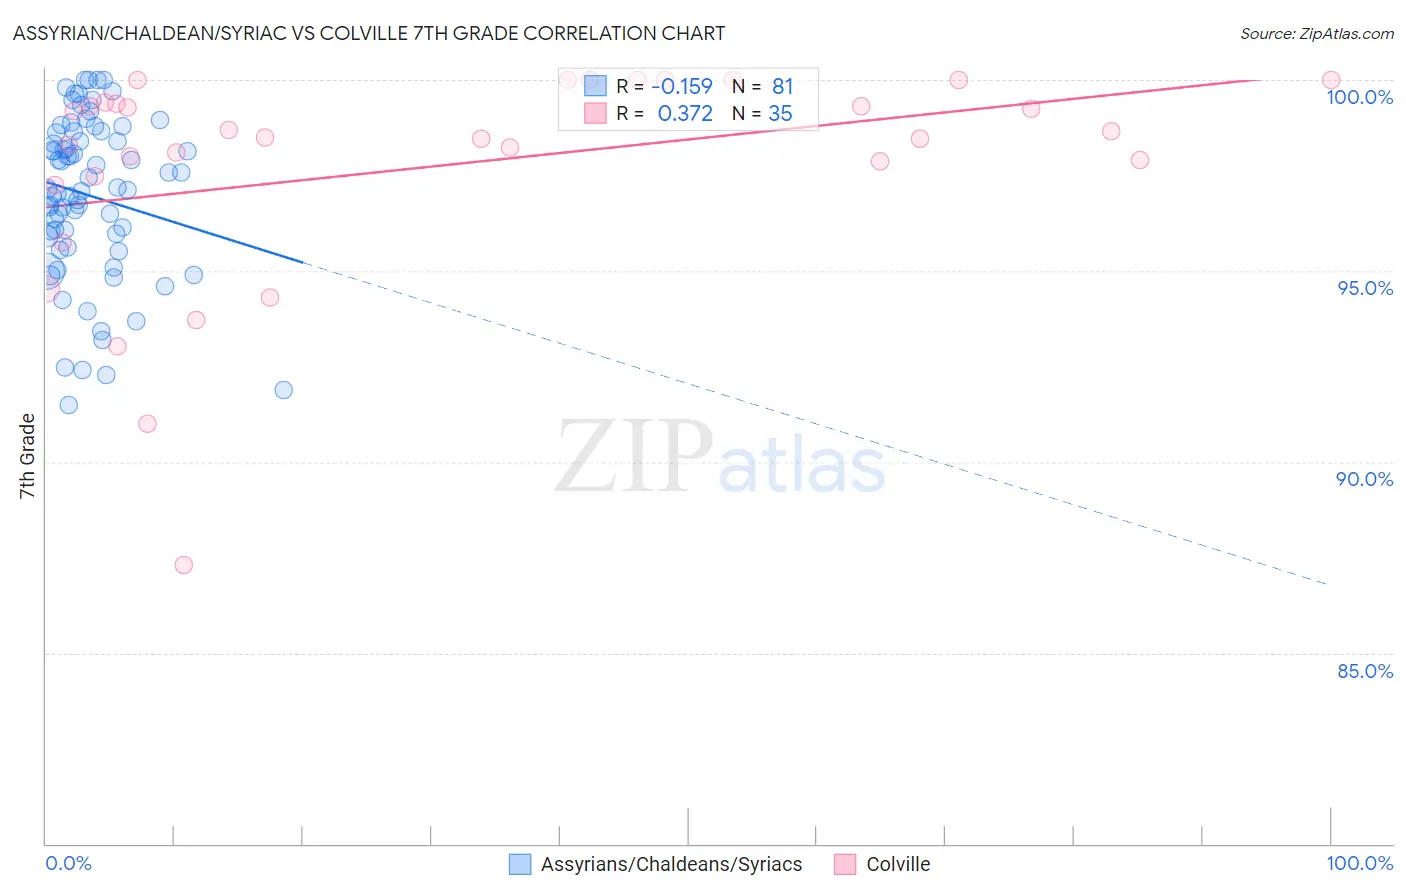
Assyrian/Chaldean/Syriac vs Colville 7th Grade Correlation Chart
The statistical analysis conducted on geographies consisting of 110,318,304 people shows a poor negative correlation between the proportion of Assyrians/Chaldeans/Syriacs and percentage of population with at least 7th grade education in the United States with a correlation coefficient (R) of -0.159 and weighted average of 95.8%. Similarly, the statistical analysis conducted on geographies consisting of 34,682,094 people shows a mild positive correlation between the proportion of Colville and percentage of population with at least 7th grade education in the United States with a correlation coefficient (R) of 0.372 and weighted average of 96.4%, a difference of 0.58%.
7th Grade Correlation Summary
| Measurement | Assyrian/Chaldean/Syriac | Colville |
| Minimum | 91.5% | 87.3% |
| Maximum | 100.0% | 100.0% |
| Range | 8.5% | 12.7% |
| Mean | 97.0% | 97.7% |
| Median | 97.1% | 98.5% |
| Interquartile 25% (IQ1) | 95.8% | 97.5% |
| Interquartile 75% (IQ3) | 98.7% | 99.4% |
| Interquartile Range (IQR) | 2.9% | 1.9% |
| Standard Deviation (Sample) | 2.1% | 2.9% |
| Standard Deviation (Population) | 2.1% | 2.8% |
Similar Demographics by 7th Grade
Demographics Similar to Assyrians/Chaldeans/Syriacs by 7th Grade
In terms of 7th grade, the demographic groups most similar to Assyrians/Chaldeans/Syriacs are Immigrants from Argentina (95.9%, a difference of 0.010%), Immigrants from Northern Africa (95.8%, a difference of 0.010%), Comanche (95.8%, a difference of 0.010%), Argentinean (95.9%, a difference of 0.020%), and Moroccan (95.8%, a difference of 0.020%).
| Demographics | Rating | Rank | 7th Grade |
| Immigrants | Zaire | 26.7 /100 | #197 | Fair 95.9% |
| Paraguayans | 24.8 /100 | #198 | Fair 95.9% |
| Guamanians/Chamorros | 23.5 /100 | #199 | Fair 95.9% |
| Argentineans | 23.2 /100 | #200 | Fair 95.9% |
| Immigrants | Argentina | 21.9 /100 | #201 | Fair 95.9% |
| Immigrants | Northern Africa | 21.4 /100 | #202 | Fair 95.8% |
| Comanche | 21.1 /100 | #203 | Fair 95.8% |
| Assyrians/Chaldeans/Syriacs | 20.5 /100 | #204 | Fair 95.8% |
| Moroccans | 18.9 /100 | #205 | Poor 95.8% |
| Africans | 17.6 /100 | #206 | Poor 95.8% |
| Navajo | 17.0 /100 | #207 | Poor 95.8% |
| Immigrants | Sudan | 17.0 /100 | #208 | Poor 95.8% |
| Dutch West Indians | 16.1 /100 | #209 | Poor 95.8% |
| Hawaiians | 16.0 /100 | #210 | Poor 95.8% |
| Portuguese | 13.6 /100 | #211 | Poor 95.8% |
Demographics Similar to Colville by 7th Grade
In terms of 7th grade, the demographic groups most similar to Colville are Filipino (96.4%, a difference of 0.010%), Hmong (96.4%, a difference of 0.010%), Soviet Union (96.4%, a difference of 0.010%), Immigrants from Kuwait (96.4%, a difference of 0.010%), and Immigrants from Serbia (96.4%, a difference of 0.020%).
| Demographics | Rating | Rank | 7th Grade |
| Immigrants | Bulgaria | 94.0 /100 | #125 | Exceptional 96.4% |
| Palestinians | 93.5 /100 | #126 | Exceptional 96.4% |
| Immigrants | Bosnia and Herzegovina | 93.3 /100 | #127 | Exceptional 96.4% |
| Immigrants | Romania | 93.2 /100 | #128 | Exceptional 96.4% |
| Immigrants | North Macedonia | 93.1 /100 | #129 | Exceptional 96.4% |
| Immigrants | Serbia | 92.8 /100 | #130 | Exceptional 96.4% |
| Filipinos | 92.1 /100 | #131 | Exceptional 96.4% |
| Colville | 91.7 /100 | #132 | Exceptional 96.4% |
| Hmong | 91.5 /100 | #133 | Exceptional 96.4% |
| Soviet Union | 91.2 /100 | #134 | Exceptional 96.4% |
| Immigrants | Kuwait | 91.1 /100 | #135 | Exceptional 96.4% |
| Immigrants | Hungary | 90.6 /100 | #136 | Exceptional 96.4% |
| Immigrants | Turkey | 90.2 /100 | #137 | Exceptional 96.4% |
| Jordanians | 90.0 /100 | #138 | Excellent 96.4% |
| Basques | 89.3 /100 | #139 | Excellent 96.4% |