Black/African American vs Immigrants from Latvia 11th Grade
COMPARE
Black/African American
Immigrants from Latvia
11th Grade
11th Grade Comparison
Blacks/African Americans
Immigrants from Latvia
91.4%
11TH GRADE
0.7/ 100
METRIC RATING
255th/ 347
METRIC RANK
93.8%
11TH GRADE
99.6/ 100
METRIC RATING
75th/ 347
METRIC RANK
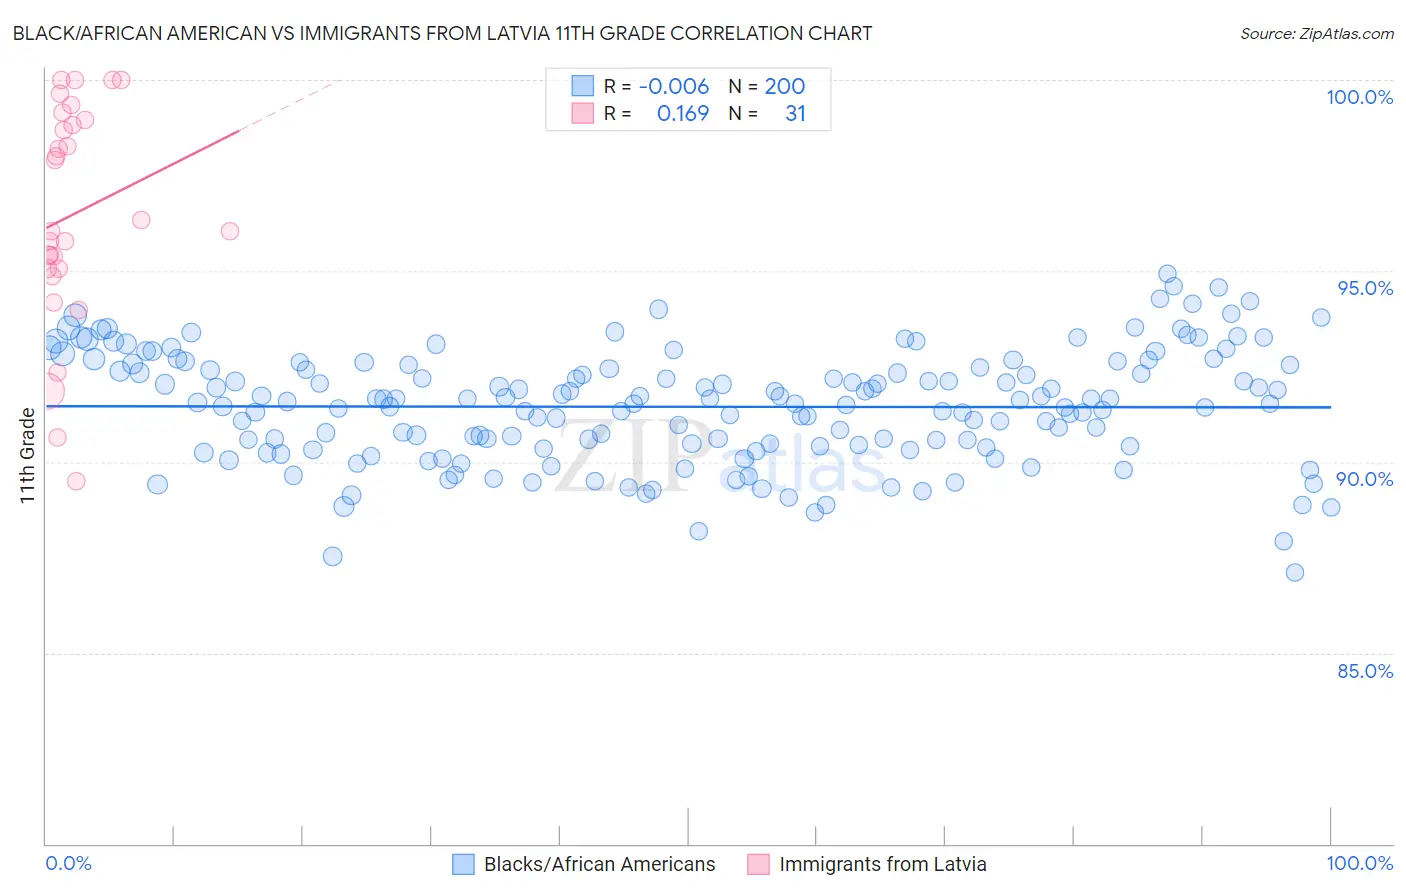
Black/African American vs Immigrants from Latvia 11th Grade Correlation Chart
The statistical analysis conducted on geographies consisting of 566,048,325 people shows no correlation between the proportion of Blacks/African Americans and percentage of population with at least 11th grade education in the United States with a correlation coefficient (R) of -0.006 and weighted average of 91.4%. Similarly, the statistical analysis conducted on geographies consisting of 113,735,345 people shows a poor positive correlation between the proportion of Immigrants from Latvia and percentage of population with at least 11th grade education in the United States with a correlation coefficient (R) of 0.169 and weighted average of 93.8%, a difference of 2.6%.
11th Grade Correlation Summary
| Measurement | Black/African American | Immigrants from Latvia |
| Minimum | 87.1% | 89.5% |
| Maximum | 94.9% | 100.0% |
| Range | 7.8% | 10.5% |
| Mean | 91.4% | 96.5% |
| Median | 91.6% | 96.1% |
| Interquartile 25% (IQ1) | 90.4% | 95.1% |
| Interquartile 75% (IQ3) | 92.5% | 98.9% |
| Interquartile Range (IQR) | 2.1% | 3.9% |
| Standard Deviation (Sample) | 1.5% | 2.9% |
| Standard Deviation (Population) | 1.5% | 2.8% |
Similar Demographics by 11th Grade
Demographics Similar to Blacks/African Americans by 11th Grade
In terms of 11th grade, the demographic groups most similar to Blacks/African Americans are Immigrants from Eritrea (91.4%, a difference of 0.010%), Immigrants from Senegal (91.4%, a difference of 0.010%), Cajun (91.4%, a difference of 0.010%), Immigrants from South America (91.4%, a difference of 0.020%), and Immigrants from Nigeria (91.4%, a difference of 0.030%).
| Demographics | Rating | Rank | 11th Grade |
| Immigrants | Uzbekistan | 1.0 /100 | #248 | Tragic 91.5% |
| Peruvians | 1.0 /100 | #249 | Tragic 91.5% |
| Ghanaians | 0.9 /100 | #250 | Tragic 91.5% |
| Immigrants | Costa Rica | 0.9 /100 | #251 | Tragic 91.4% |
| Immigrants | Nigeria | 0.8 /100 | #252 | Tragic 91.4% |
| Immigrants | South America | 0.8 /100 | #253 | Tragic 91.4% |
| Immigrants | Eritrea | 0.7 /100 | #254 | Tragic 91.4% |
| Blacks/African Americans | 0.7 /100 | #255 | Tragic 91.4% |
| Immigrants | Senegal | 0.7 /100 | #256 | Tragic 91.4% |
| Cajuns | 0.7 /100 | #257 | Tragic 91.4% |
| Immigrants | Colombia | 0.6 /100 | #258 | Tragic 91.4% |
| Jamaicans | 0.6 /100 | #259 | Tragic 91.4% |
| Spanish Americans | 0.6 /100 | #260 | Tragic 91.4% |
| Taiwanese | 0.6 /100 | #261 | Tragic 91.3% |
| Immigrants | Uruguay | 0.5 /100 | #262 | Tragic 91.3% |
Demographics Similar to Immigrants from Latvia by 11th Grade
In terms of 11th grade, the demographic groups most similar to Immigrants from Latvia are Romanian (93.8%, a difference of 0.020%), Immigrants from Czechoslovakia (93.8%, a difference of 0.020%), Celtic (93.7%, a difference of 0.030%), Aleut (93.7%, a difference of 0.030%), and Soviet Union (93.7%, a difference of 0.030%).
| Demographics | Rating | Rank | 11th Grade |
| Zimbabweans | 99.8 /100 | #68 | Exceptional 93.9% |
| Scotch-Irish | 99.8 /100 | #69 | Exceptional 93.9% |
| Immigrants | England | 99.7 /100 | #70 | Exceptional 93.8% |
| Immigrants | South Africa | 99.7 /100 | #71 | Exceptional 93.8% |
| Immigrants | Japan | 99.7 /100 | #72 | Exceptional 93.8% |
| Romanians | 99.6 /100 | #73 | Exceptional 93.8% |
| Immigrants | Czechoslovakia | 99.6 /100 | #74 | Exceptional 93.8% |
| Immigrants | Latvia | 99.6 /100 | #75 | Exceptional 93.8% |
| Celtics | 99.5 /100 | #76 | Exceptional 93.7% |
| Aleuts | 99.5 /100 | #77 | Exceptional 93.7% |
| Soviet Union | 99.5 /100 | #78 | Exceptional 93.7% |
| Immigrants | Denmark | 99.5 /100 | #79 | Exceptional 93.7% |
| Canadians | 99.5 /100 | #80 | Exceptional 93.7% |
| Immigrants | Moldova | 99.5 /100 | #81 | Exceptional 93.7% |
| Immigrants | Saudi Arabia | 99.3 /100 | #82 | Exceptional 93.7% |