Bulgarian vs Immigrants from Latvia 11th Grade
COMPARE
Bulgarian
Immigrants from Latvia
11th Grade
11th Grade Comparison
Bulgarians
Immigrants from Latvia
94.5%
11TH GRADE
100.0/ 100
METRIC RATING
15th/ 347
METRIC RANK
93.8%
11TH GRADE
99.6/ 100
METRIC RATING
75th/ 347
METRIC RANK
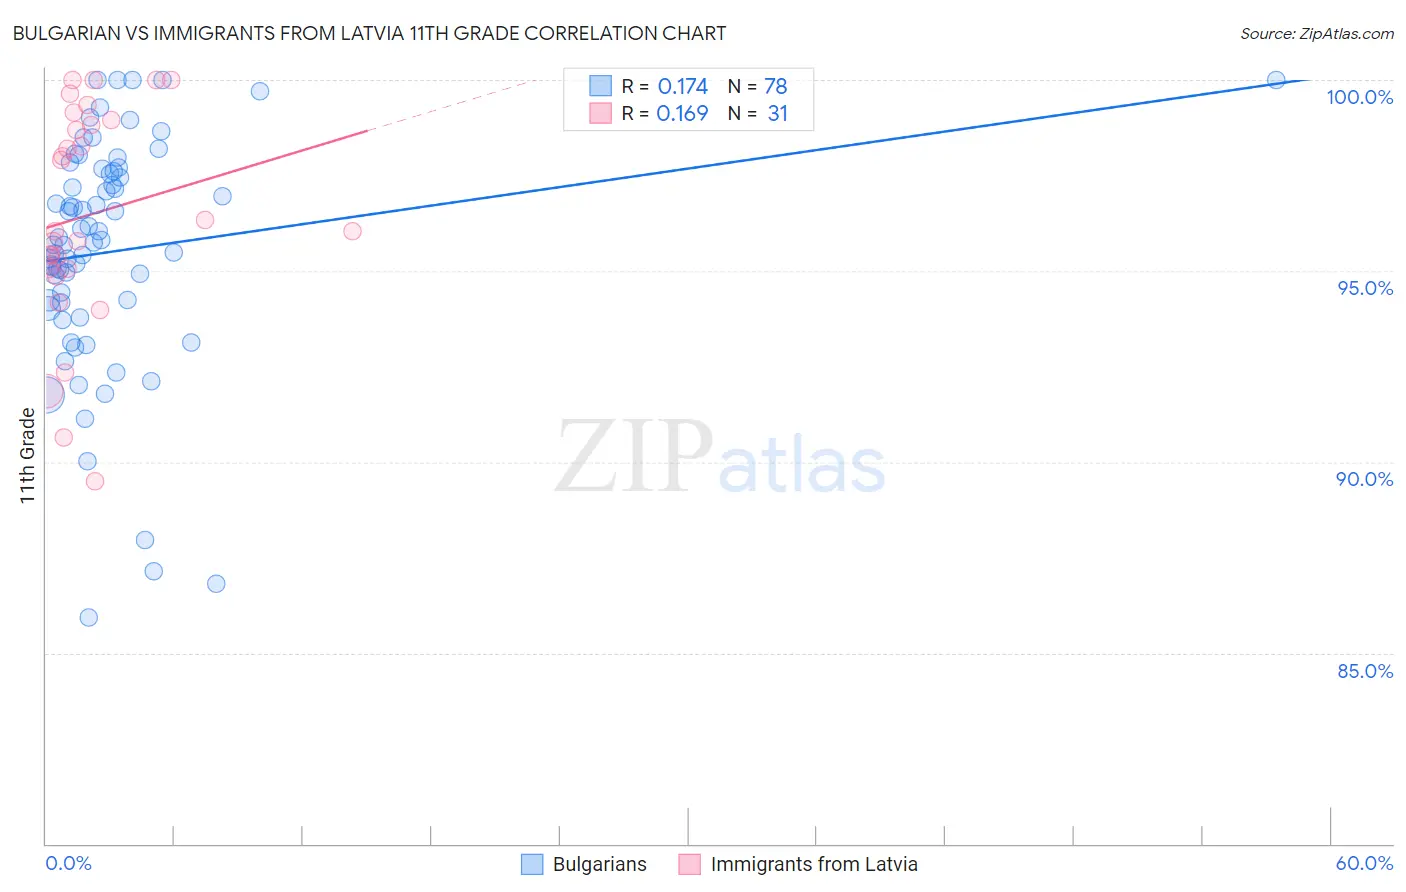
Bulgarian vs Immigrants from Latvia 11th Grade Correlation Chart
The statistical analysis conducted on geographies consisting of 205,633,404 people shows a poor positive correlation between the proportion of Bulgarians and percentage of population with at least 11th grade education in the United States with a correlation coefficient (R) of 0.174 and weighted average of 94.5%. Similarly, the statistical analysis conducted on geographies consisting of 113,735,345 people shows a poor positive correlation between the proportion of Immigrants from Latvia and percentage of population with at least 11th grade education in the United States with a correlation coefficient (R) of 0.169 and weighted average of 93.8%, a difference of 0.77%.
11th Grade Correlation Summary
| Measurement | Bulgarian | Immigrants from Latvia |
| Minimum | 85.9% | 89.5% |
| Maximum | 100.0% | 100.0% |
| Range | 14.1% | 10.5% |
| Mean | 95.5% | 96.5% |
| Median | 95.8% | 96.1% |
| Interquartile 25% (IQ1) | 94.2% | 95.1% |
| Interquartile 75% (IQ3) | 97.6% | 98.9% |
| Interquartile Range (IQR) | 3.4% | 3.9% |
| Standard Deviation (Sample) | 3.0% | 2.9% |
| Standard Deviation (Population) | 3.0% | 2.8% |
Similar Demographics by 11th Grade
Demographics Similar to Bulgarians by 11th Grade
In terms of 11th grade, the demographic groups most similar to Bulgarians are Immigrants from India (94.5%, a difference of 0.010%), Luxembourger (94.5%, a difference of 0.010%), Maltese (94.5%, a difference of 0.010%), Scandinavian (94.5%, a difference of 0.010%), and Italian (94.5%, a difference of 0.050%).
| Demographics | Rating | Rank | 11th Grade |
| Croatians | 100.0 /100 | #8 | Exceptional 94.7% |
| Danes | 100.0 /100 | #9 | Exceptional 94.7% |
| Finns | 100.0 /100 | #10 | Exceptional 94.7% |
| Germans | 100.0 /100 | #11 | Exceptional 94.7% |
| Latvians | 100.0 /100 | #12 | Exceptional 94.7% |
| Chinese | 100.0 /100 | #13 | Exceptional 94.6% |
| Eastern Europeans | 100.0 /100 | #14 | Exceptional 94.6% |
| Bulgarians | 100.0 /100 | #15 | Exceptional 94.5% |
| Immigrants | India | 100.0 /100 | #16 | Exceptional 94.5% |
| Luxembourgers | 100.0 /100 | #17 | Exceptional 94.5% |
| Maltese | 100.0 /100 | #18 | Exceptional 94.5% |
| Scandinavians | 100.0 /100 | #19 | Exceptional 94.5% |
| Italians | 100.0 /100 | #20 | Exceptional 94.5% |
| Tlingit-Haida | 100.0 /100 | #21 | Exceptional 94.4% |
| Tsimshian | 100.0 /100 | #22 | Exceptional 94.4% |
Demographics Similar to Immigrants from Latvia by 11th Grade
In terms of 11th grade, the demographic groups most similar to Immigrants from Latvia are Romanian (93.8%, a difference of 0.020%), Immigrants from Czechoslovakia (93.8%, a difference of 0.020%), Celtic (93.7%, a difference of 0.030%), Aleut (93.7%, a difference of 0.030%), and Soviet Union (93.7%, a difference of 0.030%).
| Demographics | Rating | Rank | 11th Grade |
| Zimbabweans | 99.8 /100 | #68 | Exceptional 93.9% |
| Scotch-Irish | 99.8 /100 | #69 | Exceptional 93.9% |
| Immigrants | England | 99.7 /100 | #70 | Exceptional 93.8% |
| Immigrants | South Africa | 99.7 /100 | #71 | Exceptional 93.8% |
| Immigrants | Japan | 99.7 /100 | #72 | Exceptional 93.8% |
| Romanians | 99.6 /100 | #73 | Exceptional 93.8% |
| Immigrants | Czechoslovakia | 99.6 /100 | #74 | Exceptional 93.8% |
| Immigrants | Latvia | 99.6 /100 | #75 | Exceptional 93.8% |
| Celtics | 99.5 /100 | #76 | Exceptional 93.7% |
| Aleuts | 99.5 /100 | #77 | Exceptional 93.7% |
| Soviet Union | 99.5 /100 | #78 | Exceptional 93.7% |
| Immigrants | Denmark | 99.5 /100 | #79 | Exceptional 93.7% |
| Canadians | 99.5 /100 | #80 | Exceptional 93.7% |
| Immigrants | Moldova | 99.5 /100 | #81 | Exceptional 93.7% |
| Immigrants | Saudi Arabia | 99.3 /100 | #82 | Exceptional 93.7% |