Assyrian/Chaldean/Syriac vs French American Indian 1st Grade
COMPARE
Assyrian/Chaldean/Syriac
French American Indian
1st Grade
1st Grade Comparison
Assyrians/Chaldeans/Syriacs
French American Indians
97.5%
1ST GRADE
0.4/ 100
METRIC RATING
262nd/ 347
METRIC RANK
98.0%
1ST GRADE
63.7/ 100
METRIC RATING
159th/ 347
METRIC RANK
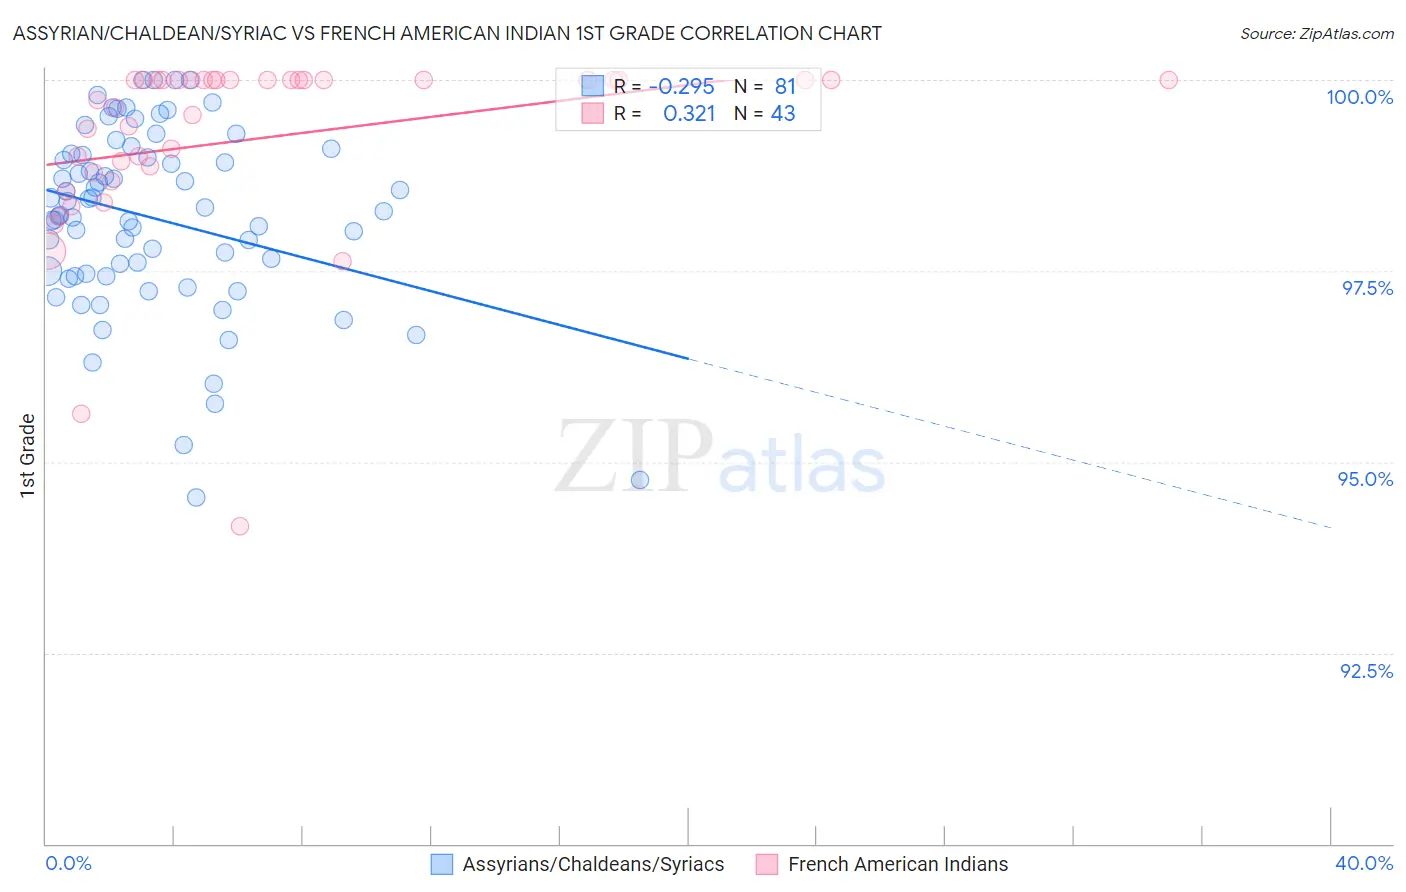
Assyrian/Chaldean/Syriac vs French American Indian 1st Grade Correlation Chart
The statistical analysis conducted on geographies consisting of 110,318,304 people shows a weak negative correlation between the proportion of Assyrians/Chaldeans/Syriacs and percentage of population with at least 1st grade education in the United States with a correlation coefficient (R) of -0.295 and weighted average of 97.5%. Similarly, the statistical analysis conducted on geographies consisting of 131,974,854 people shows a mild positive correlation between the proportion of French American Indians and percentage of population with at least 1st grade education in the United States with a correlation coefficient (R) of 0.321 and weighted average of 98.0%, a difference of 0.47%.
1st Grade Correlation Summary
| Measurement | Assyrian/Chaldean/Syriac | French American Indian |
| Minimum | 94.5% | 94.2% |
| Maximum | 100.0% | 100.0% |
| Range | 5.5% | 5.8% |
| Mean | 98.2% | 99.2% |
| Median | 98.3% | 100.0% |
| Interquartile 25% (IQ1) | 97.4% | 98.8% |
| Interquartile 75% (IQ3) | 99.0% | 100.0% |
| Interquartile Range (IQR) | 1.6% | 1.2% |
| Standard Deviation (Sample) | 1.2% | 1.2% |
| Standard Deviation (Population) | 1.2% | 1.2% |
Similar Demographics by 1st Grade
Demographics Similar to Assyrians/Chaldeans/Syriacs by 1st Grade
In terms of 1st grade, the demographic groups most similar to Assyrians/Chaldeans/Syriacs are Immigrants from Ethiopia (97.5%, a difference of 0.0%), Immigrants from South America (97.5%, a difference of 0.0%), Taiwanese (97.5%, a difference of 0.0%), Fijian (97.5%, a difference of 0.010%), and Armenian (97.5%, a difference of 0.010%).
| Demographics | Rating | Rank | 1st Grade |
| Immigrants | Colombia | 0.6 /100 | #255 | Tragic 97.5% |
| Jamaicans | 0.6 /100 | #256 | Tragic 97.5% |
| Yaqui | 0.6 /100 | #257 | Tragic 97.5% |
| Indians (Asian) | 0.6 /100 | #258 | Tragic 97.5% |
| Fijians | 0.5 /100 | #259 | Tragic 97.5% |
| Armenians | 0.5 /100 | #260 | Tragic 97.5% |
| Immigrants | Ethiopia | 0.4 /100 | #261 | Tragic 97.5% |
| Assyrians/Chaldeans/Syriacs | 0.4 /100 | #262 | Tragic 97.5% |
| Immigrants | South America | 0.4 /100 | #263 | Tragic 97.5% |
| Taiwanese | 0.4 /100 | #264 | Tragic 97.5% |
| Cubans | 0.3 /100 | #265 | Tragic 97.5% |
| Immigrants | Liberia | 0.3 /100 | #266 | Tragic 97.5% |
| Immigrants | Sierra Leone | 0.3 /100 | #267 | Tragic 97.5% |
| Immigrants | Nigeria | 0.3 /100 | #268 | Tragic 97.5% |
| West Indians | 0.3 /100 | #269 | Tragic 97.5% |
Demographics Similar to French American Indians by 1st Grade
In terms of 1st grade, the demographic groups most similar to French American Indians are Venezuelan (98.0%, a difference of 0.0%), Immigrants from Iran (98.0%, a difference of 0.010%), Comanche (98.0%, a difference of 0.010%), Immigrants from South Central Asia (98.0%, a difference of 0.010%), and Immigrants from North Macedonia (98.0%, a difference of 0.010%).
| Demographics | Rating | Rank | 1st Grade |
| Immigrants | Moldova | 69.5 /100 | #152 | Good 98.0% |
| Soviet Union | 68.9 /100 | #153 | Good 98.0% |
| Immigrants | Iran | 66.9 /100 | #154 | Good 98.0% |
| Comanche | 66.9 /100 | #155 | Good 98.0% |
| Immigrants | South Central Asia | 66.2 /100 | #156 | Good 98.0% |
| Immigrants | North Macedonia | 65.3 /100 | #157 | Good 98.0% |
| Venezuelans | 64.7 /100 | #158 | Good 98.0% |
| French American Indians | 63.7 /100 | #159 | Good 98.0% |
| Immigrants | Russia | 59.2 /100 | #160 | Average 97.9% |
| Immigrants | Italy | 59.1 /100 | #161 | Average 97.9% |
| Immigrants | Eastern Europe | 58.9 /100 | #162 | Average 97.9% |
| Spanish Americans | 57.7 /100 | #163 | Average 97.9% |
| Brazilians | 57.6 /100 | #164 | Average 97.9% |
| Ugandans | 56.9 /100 | #165 | Average 97.9% |
| Navajo | 56.6 /100 | #166 | Average 97.9% |