Immigrants from Hungary vs Indonesian 5th Grade
COMPARE
Immigrants from Hungary
Indonesian
5th Grade
5th Grade Comparison
Immigrants from Hungary
Indonesians
97.6%
5TH GRADE
90.1/ 100
METRIC RATING
134th/ 347
METRIC RANK
96.0%
5TH GRADE
0.0/ 100
METRIC RATING
310th/ 347
METRIC RANK
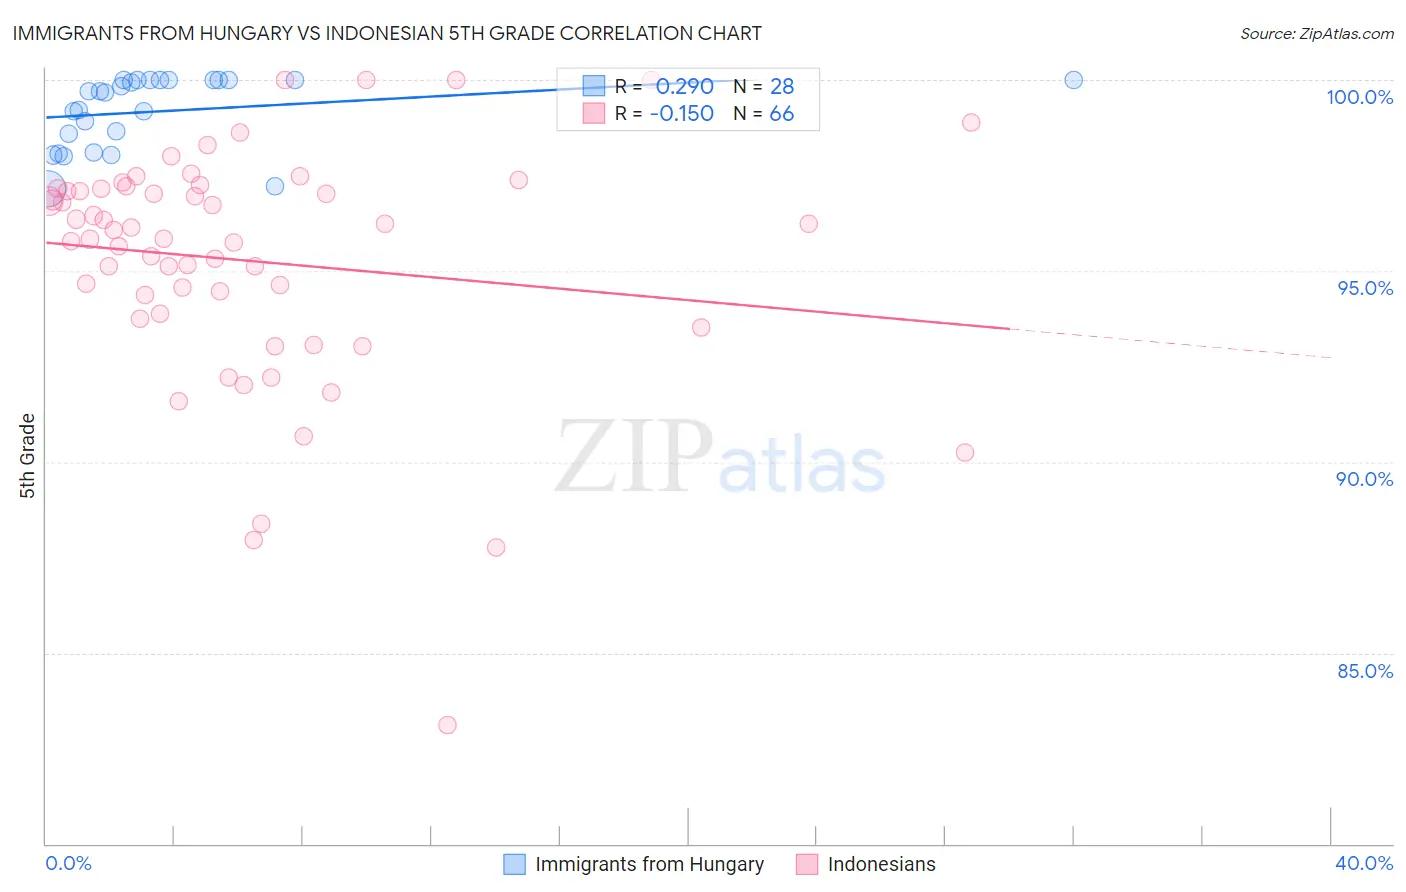
Immigrants from Hungary vs Indonesian 5th Grade Correlation Chart
The statistical analysis conducted on geographies consisting of 195,707,305 people shows a weak positive correlation between the proportion of Immigrants from Hungary and percentage of population with at least 5th grade education in the United States with a correlation coefficient (R) of 0.290 and weighted average of 97.6%. Similarly, the statistical analysis conducted on geographies consisting of 162,727,113 people shows a poor negative correlation between the proportion of Indonesians and percentage of population with at least 5th grade education in the United States with a correlation coefficient (R) of -0.150 and weighted average of 96.0%, a difference of 1.7%.
5th Grade Correlation Summary
| Measurement | Immigrants from Hungary | Indonesian |
| Minimum | 97.1% | 83.1% |
| Maximum | 100.0% | 100.0% |
| Range | 2.9% | 16.9% |
| Mean | 99.2% | 95.3% |
| Median | 99.7% | 96.0% |
| Interquartile 25% (IQ1) | 98.4% | 93.9% |
| Interquartile 75% (IQ3) | 100.0% | 97.1% |
| Interquartile Range (IQR) | 1.6% | 3.3% |
| Standard Deviation (Sample) | 0.93% | 3.1% |
| Standard Deviation (Population) | 0.92% | 3.1% |
Similar Demographics by 5th Grade
Demographics Similar to Immigrants from Hungary by 5th Grade
In terms of 5th grade, the demographic groups most similar to Immigrants from Hungary are Immigrants from Kuwait (97.6%, a difference of 0.0%), Cambodian (97.6%, a difference of 0.0%), Pima (97.6%, a difference of 0.010%), Palestinian (97.5%, a difference of 0.010%), and Colville (97.6%, a difference of 0.020%).
| Demographics | Rating | Rank | 5th Grade |
| Immigrants | Serbia | 92.3 /100 | #127 | Exceptional 97.6% |
| Colville | 92.0 /100 | #128 | Exceptional 97.6% |
| Immigrants | Europe | 91.9 /100 | #129 | Exceptional 97.6% |
| Immigrants | Romania | 91.6 /100 | #130 | Exceptional 97.6% |
| Pima | 91.2 /100 | #131 | Exceptional 97.6% |
| Immigrants | Kuwait | 90.4 /100 | #132 | Exceptional 97.6% |
| Cambodians | 90.2 /100 | #133 | Exceptional 97.6% |
| Immigrants | Hungary | 90.1 /100 | #134 | Exceptional 97.6% |
| Palestinians | 89.3 /100 | #135 | Excellent 97.5% |
| Immigrants | Moldova | 87.5 /100 | #136 | Excellent 97.5% |
| Filipinos | 86.8 /100 | #137 | Excellent 97.5% |
| Blackfeet | 86.8 /100 | #138 | Excellent 97.5% |
| Immigrants | Turkey | 86.7 /100 | #139 | Excellent 97.5% |
| Burmese | 86.1 /100 | #140 | Excellent 97.5% |
| Seminole | 85.8 /100 | #141 | Excellent 97.5% |
Demographics Similar to Indonesians by 5th Grade
In terms of 5th grade, the demographic groups most similar to Indonesians are Immigrants from Bangladesh (96.0%, a difference of 0.020%), Immigrants from Guyana (96.0%, a difference of 0.040%), Ecuadorian (96.0%, a difference of 0.050%), Vietnamese (95.9%, a difference of 0.050%), and Immigrants from Haiti (96.0%, a difference of 0.060%).
| Demographics | Rating | Rank | 5th Grade |
| Puerto Ricans | 0.0 /100 | #303 | Tragic 96.1% |
| Immigrants | Burma/Myanmar | 0.0 /100 | #304 | Tragic 96.1% |
| Immigrants | Laos | 0.0 /100 | #305 | Tragic 96.0% |
| Immigrants | Haiti | 0.0 /100 | #306 | Tragic 96.0% |
| Immigrants | Caribbean | 0.0 /100 | #307 | Tragic 96.0% |
| Ecuadorians | 0.0 /100 | #308 | Tragic 96.0% |
| Immigrants | Guyana | 0.0 /100 | #309 | Tragic 96.0% |
| Indonesians | 0.0 /100 | #310 | Tragic 96.0% |
| Immigrants | Bangladesh | 0.0 /100 | #311 | Tragic 96.0% |
| Vietnamese | 0.0 /100 | #312 | Tragic 95.9% |
| Bangladeshis | 0.0 /100 | #313 | Tragic 95.9% |
| Immigrants | Portugal | 0.0 /100 | #314 | Tragic 95.9% |
| Nicaraguans | 0.0 /100 | #315 | Tragic 95.9% |
| Immigrants | Ecuador | 0.0 /100 | #316 | Tragic 95.8% |
| Belizeans | 0.0 /100 | #317 | Tragic 95.8% |