Thai vs Immigrants from Indonesia High School Diploma
COMPARE
Thai
Immigrants from Indonesia
High School Diploma
High School Diploma Comparison
Thais
Immigrants from Indonesia
91.5%
HIGH SCHOOL DIPLOMA
99.9/ 100
METRIC RATING
25th/ 347
METRIC RANK
89.1%
HIGH SCHOOL DIPLOMA
50.3/ 100
METRIC RATING
173rd/ 347
METRIC RANK
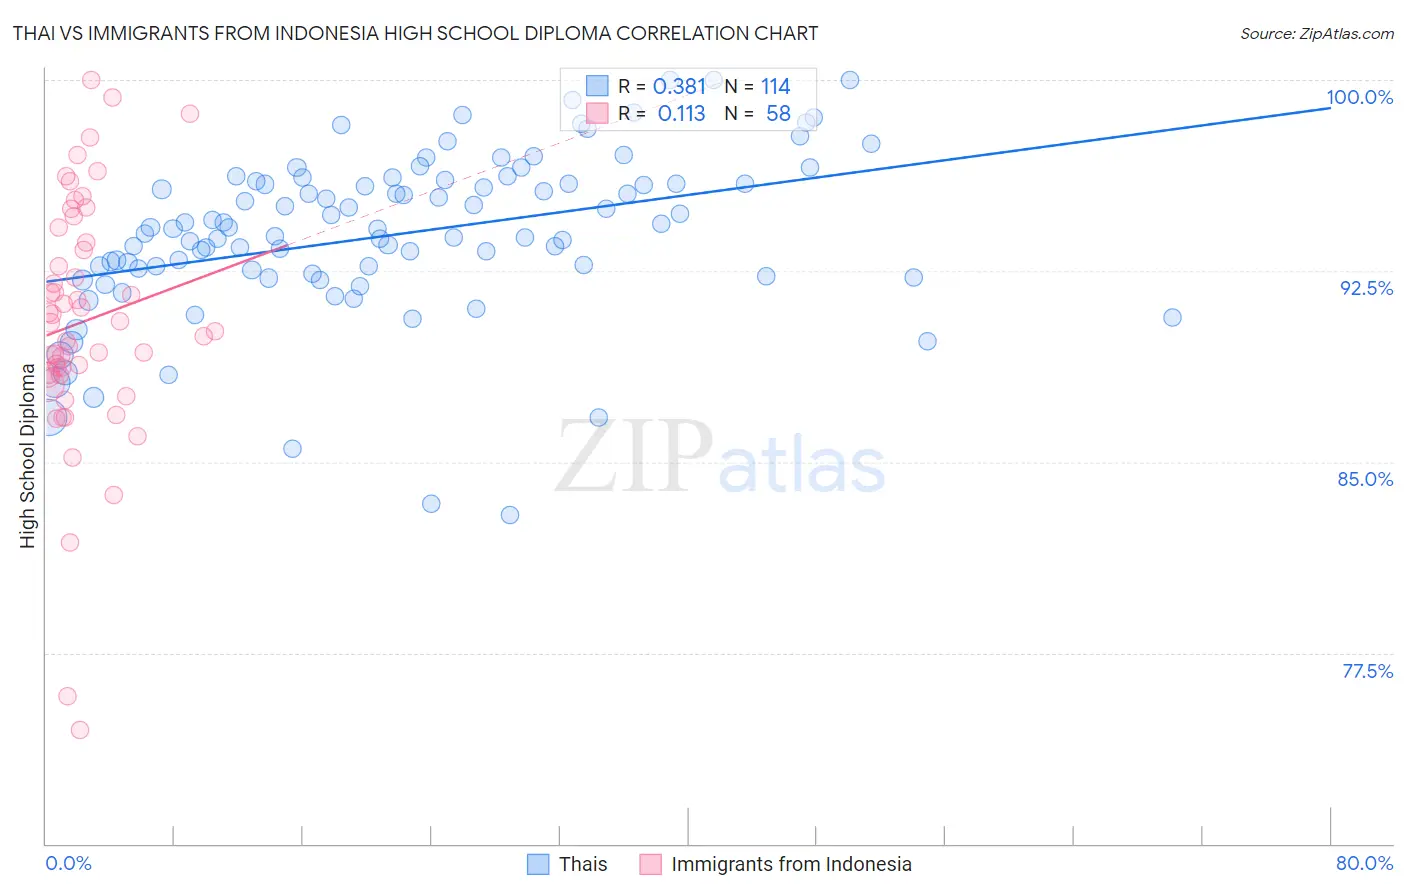
Thai vs Immigrants from Indonesia High School Diploma Correlation Chart
The statistical analysis conducted on geographies consisting of 475,814,962 people shows a mild positive correlation between the proportion of Thais and percentage of population with at least high school diploma education in the United States with a correlation coefficient (R) of 0.381 and weighted average of 91.5%. Similarly, the statistical analysis conducted on geographies consisting of 215,765,946 people shows a poor positive correlation between the proportion of Immigrants from Indonesia and percentage of population with at least high school diploma education in the United States with a correlation coefficient (R) of 0.113 and weighted average of 89.1%, a difference of 2.7%.
High School Diploma Correlation Summary
| Measurement | Thai | Immigrants from Indonesia |
| Minimum | 82.9% | 74.5% |
| Maximum | 100.0% | 100.0% |
| Range | 17.1% | 25.5% |
| Mean | 93.9% | 90.5% |
| Median | 94.2% | 90.3% |
| Interquartile 25% (IQ1) | 92.4% | 88.4% |
| Interquartile 75% (IQ3) | 95.9% | 93.6% |
| Interquartile Range (IQR) | 3.5% | 5.2% |
| Standard Deviation (Sample) | 3.2% | 4.8% |
| Standard Deviation (Population) | 3.2% | 4.8% |
Similar Demographics by High School Diploma
Demographics Similar to Thais by High School Diploma
In terms of high school diploma, the demographic groups most similar to Thais are Scandinavian (91.5%, a difference of 0.0%), Italian (91.5%, a difference of 0.0%), Estonian (91.6%, a difference of 0.030%), Czech (91.6%, a difference of 0.050%), and Filipino (91.6%, a difference of 0.050%).
| Demographics | Rating | Rank | High School Diploma |
| Germans | 99.9 /100 | #18 | Exceptional 91.7% |
| Maltese | 99.9 /100 | #19 | Exceptional 91.6% |
| Czechs | 99.9 /100 | #20 | Exceptional 91.6% |
| Filipinos | 99.9 /100 | #21 | Exceptional 91.6% |
| Estonians | 99.9 /100 | #22 | Exceptional 91.6% |
| Scandinavians | 99.9 /100 | #23 | Exceptional 91.5% |
| Italians | 99.9 /100 | #24 | Exceptional 91.5% |
| Thais | 99.9 /100 | #25 | Exceptional 91.5% |
| Russians | 99.9 /100 | #26 | Exceptional 91.5% |
| Cypriots | 99.9 /100 | #27 | Exceptional 91.5% |
| Tlingit-Haida | 99.9 /100 | #28 | Exceptional 91.4% |
| Europeans | 99.9 /100 | #29 | Exceptional 91.4% |
| Iranians | 99.9 /100 | #30 | Exceptional 91.4% |
| Immigrants | Northern Europe | 99.9 /100 | #31 | Exceptional 91.4% |
| English | 99.9 /100 | #32 | Exceptional 91.4% |
Demographics Similar to Immigrants from Indonesia by High School Diploma
In terms of high school diploma, the demographic groups most similar to Immigrants from Indonesia are Hmong (89.1%, a difference of 0.0%), Nonimmigrants (89.2%, a difference of 0.020%), Immigrants from Western Asia (89.1%, a difference of 0.020%), Osage (89.1%, a difference of 0.020%), and Sudanese (89.1%, a difference of 0.030%).
| Demographics | Rating | Rank | High School Diploma |
| Immigrants | Albania | 59.4 /100 | #166 | Average 89.3% |
| Immigrants | Hong Kong | 58.6 /100 | #167 | Average 89.3% |
| Delaware | 55.8 /100 | #168 | Average 89.2% |
| Iroquois | 55.1 /100 | #169 | Average 89.2% |
| Immigrants | Morocco | 53.3 /100 | #170 | Average 89.2% |
| Spanish | 52.9 /100 | #171 | Average 89.2% |
| Immigrants | Nonimmigrants | 51.8 /100 | #172 | Average 89.2% |
| Immigrants | Indonesia | 50.3 /100 | #173 | Average 89.1% |
| Hmong | 50.0 /100 | #174 | Average 89.1% |
| Immigrants | Western Asia | 49.0 /100 | #175 | Average 89.1% |
| Osage | 48.9 /100 | #176 | Average 89.1% |
| Sudanese | 48.5 /100 | #177 | Average 89.1% |
| Sierra Leoneans | 48.4 /100 | #178 | Average 89.1% |
| Americans | 47.2 /100 | #179 | Average 89.1% |
| Bolivians | 45.2 /100 | #180 | Average 89.1% |