Armenian vs Immigrants from Sweden Professional Degree
COMPARE
Armenian
Immigrants from Sweden
Professional Degree
Professional Degree Comparison
Armenians
Immigrants from Sweden
5.3%
PROFESSIONAL DEGREE
99.7/ 100
METRIC RATING
78th/ 347
METRIC RANK
6.7%
PROFESSIONAL DEGREE
100.0/ 100
METRIC RATING
16th/ 347
METRIC RANK
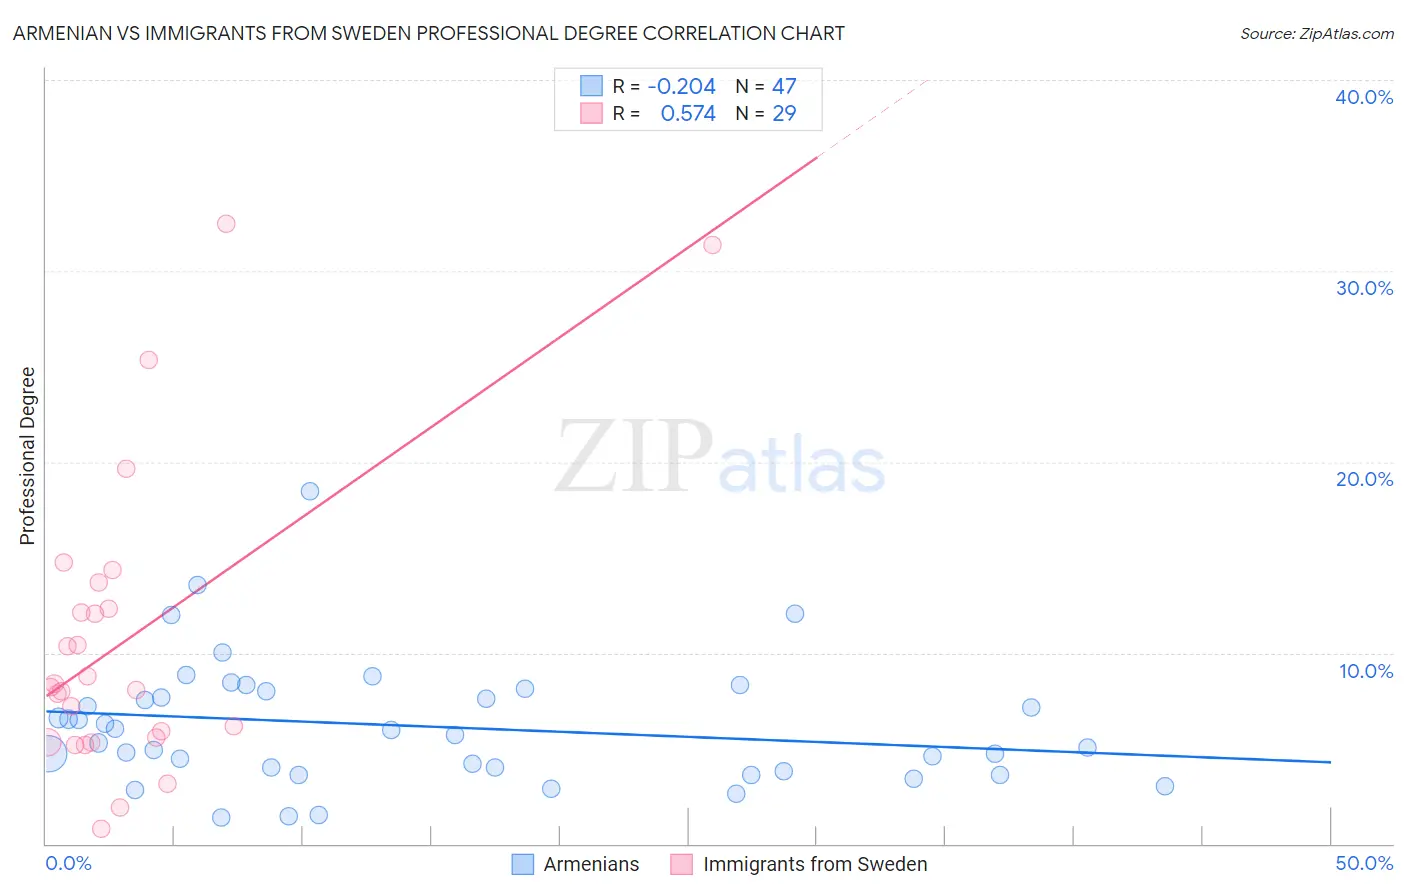
Armenian vs Immigrants from Sweden Professional Degree Correlation Chart
The statistical analysis conducted on geographies consisting of 310,624,629 people shows a weak negative correlation between the proportion of Armenians and percentage of population with at least professional degree education in the United States with a correlation coefficient (R) of -0.204 and weighted average of 5.3%. Similarly, the statistical analysis conducted on geographies consisting of 164,659,960 people shows a substantial positive correlation between the proportion of Immigrants from Sweden and percentage of population with at least professional degree education in the United States with a correlation coefficient (R) of 0.574 and weighted average of 6.7%, a difference of 25.5%.
Professional Degree Correlation Summary
| Measurement | Armenian | Immigrants from Sweden |
| Minimum | 1.4% | 0.79% |
| Maximum | 18.5% | 32.5% |
| Range | 17.1% | 31.7% |
| Mean | 6.2% | 10.7% |
| Median | 5.7% | 8.2% |
| Interquartile 25% (IQ1) | 3.8% | 5.5% |
| Interquartile 75% (IQ3) | 8.0% | 13.0% |
| Interquartile Range (IQR) | 4.1% | 7.5% |
| Standard Deviation (Sample) | 3.3% | 7.8% |
| Standard Deviation (Population) | 3.3% | 7.7% |
Similar Demographics by Professional Degree
Demographics Similar to Armenians by Professional Degree
In terms of professional degree, the demographic groups most similar to Armenians are Immigrants from Ethiopia (5.3%, a difference of 0.050%), Immigrants from Canada (5.3%, a difference of 0.090%), Immigrants from Indonesia (5.3%, a difference of 0.17%), Immigrants from North America (5.3%, a difference of 0.17%), and Ethiopian (5.4%, a difference of 0.30%).
| Demographics | Rating | Rank | Professional Degree |
| Immigrants | Western Asia | 99.8 /100 | #71 | Exceptional 5.4% |
| Lithuanians | 99.8 /100 | #72 | Exceptional 5.4% |
| Immigrants | Romania | 99.8 /100 | #73 | Exceptional 5.4% |
| Ethiopians | 99.7 /100 | #74 | Exceptional 5.4% |
| Immigrants | Indonesia | 99.7 /100 | #75 | Exceptional 5.3% |
| Immigrants | Canada | 99.7 /100 | #76 | Exceptional 5.3% |
| Immigrants | Ethiopia | 99.7 /100 | #77 | Exceptional 5.3% |
| Armenians | 99.7 /100 | #78 | Exceptional 5.3% |
| Immigrants | North America | 99.7 /100 | #79 | Exceptional 5.3% |
| Immigrants | England | 99.6 /100 | #80 | Exceptional 5.3% |
| Immigrants | Brazil | 99.6 /100 | #81 | Exceptional 5.3% |
| Romanians | 99.6 /100 | #82 | Exceptional 5.3% |
| Carpatho Rusyns | 99.6 /100 | #83 | Exceptional 5.3% |
| Immigrants | Croatia | 99.6 /100 | #84 | Exceptional 5.3% |
| Immigrants | Zimbabwe | 99.6 /100 | #85 | Exceptional 5.3% |
Demographics Similar to Immigrants from Sweden by Professional Degree
In terms of professional degree, the demographic groups most similar to Immigrants from Sweden are Immigrants from China (6.7%, a difference of 0.45%), Immigrants from France (6.8%, a difference of 1.5%), Immigrants from Eastern Asia (6.6%, a difference of 2.0%), Soviet Union (6.6%, a difference of 2.0%), and Indian (Asian) (6.5%, a difference of 2.7%).
| Demographics | Rating | Rank | Professional Degree |
| Immigrants | Taiwan | 100.0 /100 | #9 | Exceptional 7.1% |
| Immigrants | Belgium | 100.0 /100 | #10 | Exceptional 7.0% |
| Cypriots | 100.0 /100 | #11 | Exceptional 6.9% |
| Israelis | 100.0 /100 | #12 | Exceptional 6.9% |
| Immigrants | Australia | 100.0 /100 | #13 | Exceptional 6.9% |
| Immigrants | France | 100.0 /100 | #14 | Exceptional 6.8% |
| Immigrants | China | 100.0 /100 | #15 | Exceptional 6.7% |
| Immigrants | Sweden | 100.0 /100 | #16 | Exceptional 6.7% |
| Immigrants | Eastern Asia | 100.0 /100 | #17 | Exceptional 6.6% |
| Soviet Union | 100.0 /100 | #18 | Exceptional 6.6% |
| Indians (Asian) | 100.0 /100 | #19 | Exceptional 6.5% |
| Immigrants | Denmark | 100.0 /100 | #20 | Exceptional 6.4% |
| Immigrants | Hong Kong | 100.0 /100 | #21 | Exceptional 6.4% |
| Immigrants | Japan | 100.0 /100 | #22 | Exceptional 6.4% |
| Russians | 100.0 /100 | #23 | Exceptional 6.3% |