Armenian vs Nepalese Professional Degree
COMPARE
Armenian
Nepalese
Professional Degree
Professional Degree Comparison
Armenians
Nepalese
5.3%
PROFESSIONAL DEGREE
99.7/ 100
METRIC RATING
78th/ 347
METRIC RANK
3.2%
PROFESSIONAL DEGREE
0.1/ 100
METRIC RATING
317th/ 347
METRIC RANK
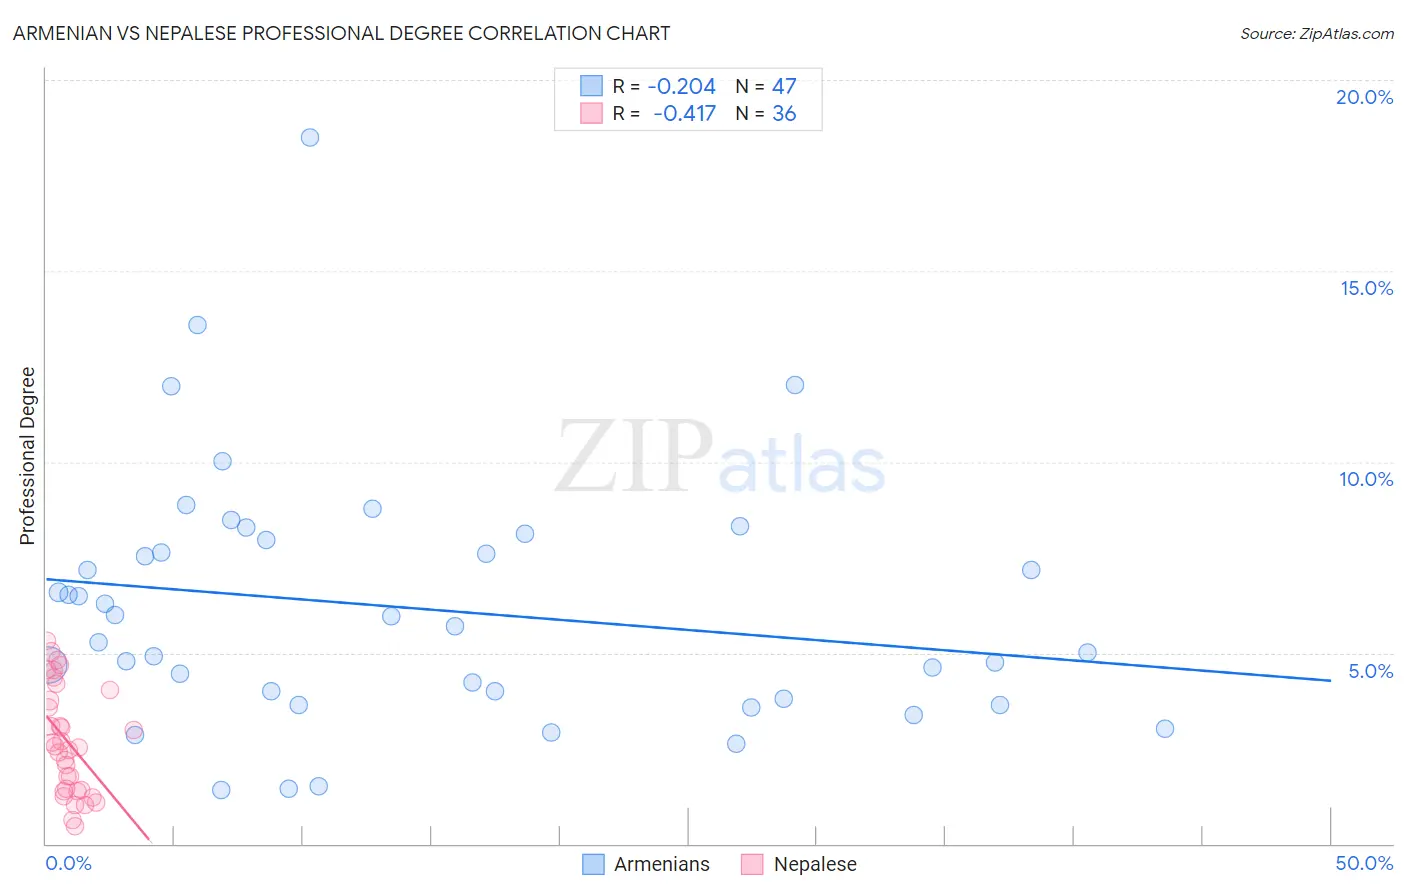
Armenian vs Nepalese Professional Degree Correlation Chart
The statistical analysis conducted on geographies consisting of 310,624,629 people shows a weak negative correlation between the proportion of Armenians and percentage of population with at least professional degree education in the United States with a correlation coefficient (R) of -0.204 and weighted average of 5.3%. Similarly, the statistical analysis conducted on geographies consisting of 24,504,313 people shows a moderate negative correlation between the proportion of Nepalese and percentage of population with at least professional degree education in the United States with a correlation coefficient (R) of -0.417 and weighted average of 3.2%, a difference of 64.9%.
Professional Degree Correlation Summary
| Measurement | Armenian | Nepalese |
| Minimum | 1.4% | 0.47% |
| Maximum | 18.5% | 5.3% |
| Range | 17.1% | 4.9% |
| Mean | 6.2% | 2.7% |
| Median | 5.7% | 2.5% |
| Interquartile 25% (IQ1) | 3.8% | 1.4% |
| Interquartile 75% (IQ3) | 8.0% | 3.9% |
| Interquartile Range (IQR) | 4.1% | 2.5% |
| Standard Deviation (Sample) | 3.3% | 1.4% |
| Standard Deviation (Population) | 3.3% | 1.4% |
Similar Demographics by Professional Degree
Demographics Similar to Armenians by Professional Degree
In terms of professional degree, the demographic groups most similar to Armenians are Immigrants from Ethiopia (5.3%, a difference of 0.050%), Immigrants from Canada (5.3%, a difference of 0.090%), Immigrants from Indonesia (5.3%, a difference of 0.17%), Immigrants from North America (5.3%, a difference of 0.17%), and Ethiopian (5.4%, a difference of 0.30%).
| Demographics | Rating | Rank | Professional Degree |
| Immigrants | Western Asia | 99.8 /100 | #71 | Exceptional 5.4% |
| Lithuanians | 99.8 /100 | #72 | Exceptional 5.4% |
| Immigrants | Romania | 99.8 /100 | #73 | Exceptional 5.4% |
| Ethiopians | 99.7 /100 | #74 | Exceptional 5.4% |
| Immigrants | Indonesia | 99.7 /100 | #75 | Exceptional 5.3% |
| Immigrants | Canada | 99.7 /100 | #76 | Exceptional 5.3% |
| Immigrants | Ethiopia | 99.7 /100 | #77 | Exceptional 5.3% |
| Armenians | 99.7 /100 | #78 | Exceptional 5.3% |
| Immigrants | North America | 99.7 /100 | #79 | Exceptional 5.3% |
| Immigrants | England | 99.6 /100 | #80 | Exceptional 5.3% |
| Immigrants | Brazil | 99.6 /100 | #81 | Exceptional 5.3% |
| Romanians | 99.6 /100 | #82 | Exceptional 5.3% |
| Carpatho Rusyns | 99.6 /100 | #83 | Exceptional 5.3% |
| Immigrants | Croatia | 99.6 /100 | #84 | Exceptional 5.3% |
| Immigrants | Zimbabwe | 99.6 /100 | #85 | Exceptional 5.3% |
Demographics Similar to Nepalese by Professional Degree
In terms of professional degree, the demographic groups most similar to Nepalese are Immigrants from Micronesia (3.2%, a difference of 0.030%), Puerto Rican (3.2%, a difference of 0.21%), Immigrants from Laos (3.2%, a difference of 0.22%), Choctaw (3.2%, a difference of 0.27%), and Mexican American Indian (3.3%, a difference of 0.90%).
| Demographics | Rating | Rank | Professional Degree |
| Immigrants | Latin America | 0.1 /100 | #310 | Tragic 3.3% |
| Cherokee | 0.1 /100 | #311 | Tragic 3.3% |
| Sioux | 0.1 /100 | #312 | Tragic 3.3% |
| Yuman | 0.1 /100 | #313 | Tragic 3.3% |
| Mexican American Indians | 0.1 /100 | #314 | Tragic 3.3% |
| Immigrants | Laos | 0.1 /100 | #315 | Tragic 3.2% |
| Puerto Ricans | 0.1 /100 | #316 | Tragic 3.2% |
| Nepalese | 0.1 /100 | #317 | Tragic 3.2% |
| Immigrants | Micronesia | 0.1 /100 | #318 | Tragic 3.2% |
| Choctaw | 0.1 /100 | #319 | Tragic 3.2% |
| Seminole | 0.1 /100 | #320 | Tragic 3.2% |
| Tsimshian | 0.0 /100 | #321 | Tragic 3.2% |
| Hispanics or Latinos | 0.0 /100 | #322 | Tragic 3.2% |
| Inupiat | 0.0 /100 | #323 | Tragic 3.2% |
| Crow | 0.0 /100 | #324 | Tragic 3.2% |