Armenian vs Immigrants from Jordan 7th Grade
COMPARE
Armenian
Immigrants from Jordan
7th Grade
7th Grade Comparison
Armenians
Immigrants from Jordan
95.0%
7TH GRADE
0.1/ 100
METRIC RATING
284th/ 347
METRIC RANK
96.2%
7TH GRADE
77.0/ 100
METRIC RATING
155th/ 347
METRIC RANK
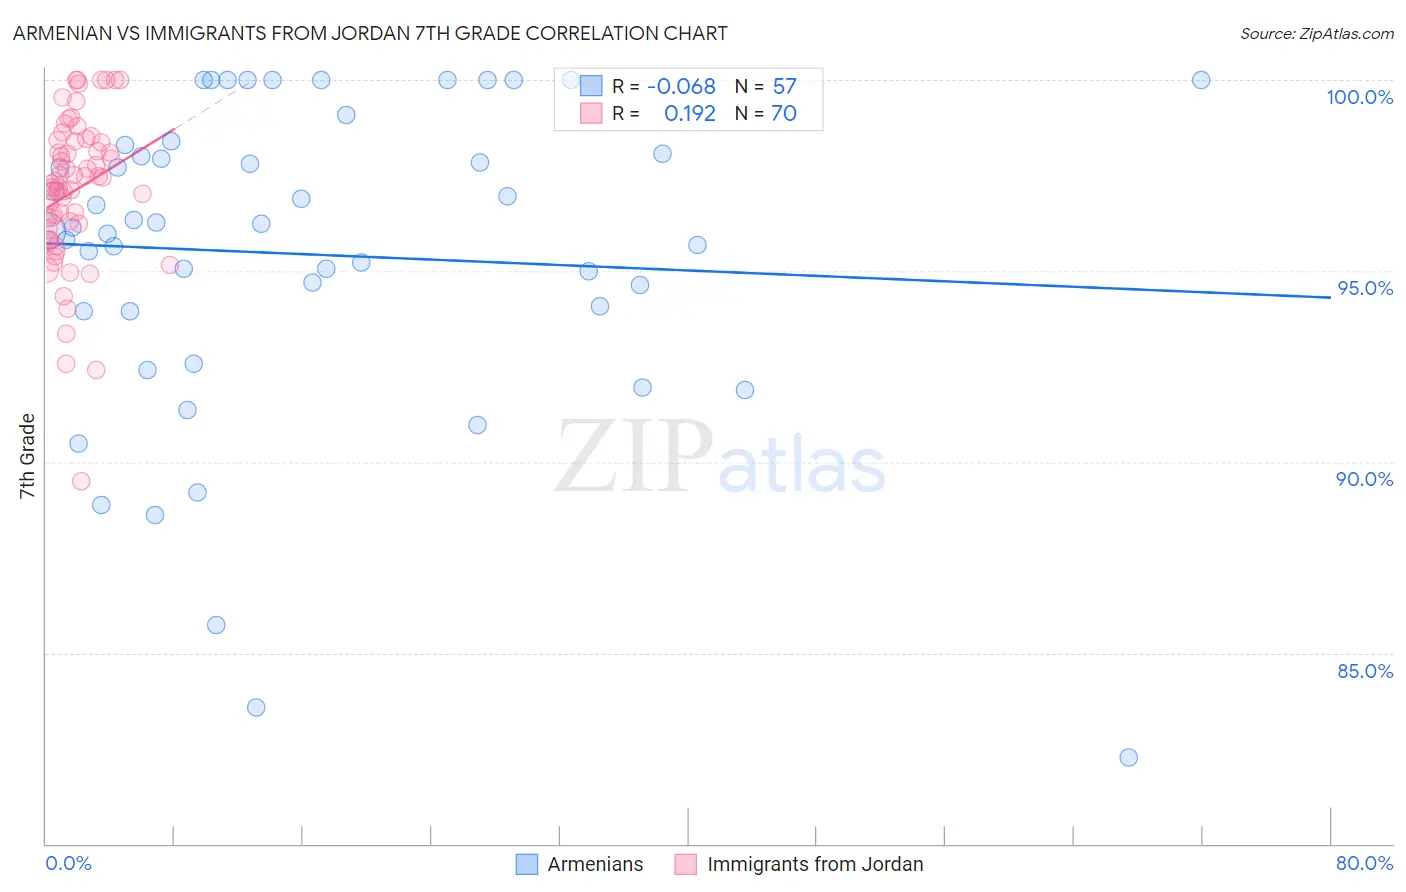
Armenian vs Immigrants from Jordan 7th Grade Correlation Chart
The statistical analysis conducted on geographies consisting of 310,954,801 people shows a slight negative correlation between the proportion of Armenians and percentage of population with at least 7th grade education in the United States with a correlation coefficient (R) of -0.068 and weighted average of 95.0%. Similarly, the statistical analysis conducted on geographies consisting of 181,269,353 people shows a poor positive correlation between the proportion of Immigrants from Jordan and percentage of population with at least 7th grade education in the United States with a correlation coefficient (R) of 0.192 and weighted average of 96.2%, a difference of 1.3%.
7th Grade Correlation Summary
| Measurement | Armenian | Immigrants from Jordan |
| Minimum | 82.3% | 89.5% |
| Maximum | 100.0% | 100.0% |
| Range | 17.7% | 10.5% |
| Mean | 95.4% | 97.1% |
| Median | 96.1% | 97.3% |
| Interquartile 25% (IQ1) | 94.0% | 96.1% |
| Interquartile 75% (IQ3) | 98.2% | 98.4% |
| Interquartile Range (IQR) | 4.2% | 2.3% |
| Standard Deviation (Sample) | 4.1% | 2.0% |
| Standard Deviation (Population) | 4.1% | 2.0% |
Similar Demographics by 7th Grade
Demographics Similar to Armenians by 7th Grade
In terms of 7th grade, the demographic groups most similar to Armenians are Immigrants from Barbados (95.0%, a difference of 0.0%), Immigrants from Eritrea (94.9%, a difference of 0.010%), Immigrants from Bolivia (95.0%, a difference of 0.060%), Immigrants from St. Vincent and the Grenadines (95.0%, a difference of 0.070%), and Tohono O'odham (95.0%, a difference of 0.070%).
| Demographics | Rating | Rank | 7th Grade |
| Immigrants | Afghanistan | 0.2 /100 | #277 | Tragic 95.1% |
| Immigrants | Trinidad and Tobago | 0.1 /100 | #278 | Tragic 95.1% |
| Barbadians | 0.1 /100 | #279 | Tragic 95.1% |
| Immigrants | St. Vincent and the Grenadines | 0.1 /100 | #280 | Tragic 95.0% |
| Tohono O'odham | 0.1 /100 | #281 | Tragic 95.0% |
| Immigrants | Bolivia | 0.1 /100 | #282 | Tragic 95.0% |
| Immigrants | Barbados | 0.1 /100 | #283 | Tragic 95.0% |
| Armenians | 0.1 /100 | #284 | Tragic 95.0% |
| Immigrants | Eritrea | 0.1 /100 | #285 | Tragic 94.9% |
| Immigrants | Philippines | 0.0 /100 | #286 | Tragic 94.9% |
| Immigrants | Peru | 0.0 /100 | #287 | Tragic 94.9% |
| British West Indians | 0.0 /100 | #288 | Tragic 94.8% |
| Taiwanese | 0.0 /100 | #289 | Tragic 94.8% |
| Malaysians | 0.0 /100 | #290 | Tragic 94.8% |
| Immigrants | Grenada | 0.0 /100 | #291 | Tragic 94.8% |
Demographics Similar to Immigrants from Jordan by 7th Grade
In terms of 7th grade, the demographic groups most similar to Immigrants from Jordan are Immigrants from Israel (96.2%, a difference of 0.0%), Immigrants from Russia (96.2%, a difference of 0.010%), Seminole (96.2%, a difference of 0.010%), Kenyan (96.2%, a difference of 0.010%), and Ugandan (96.2%, a difference of 0.010%).
| Demographics | Rating | Rank | 7th Grade |
| Israelis | 82.8 /100 | #148 | Excellent 96.3% |
| Albanians | 82.6 /100 | #149 | Excellent 96.3% |
| Immigrants | Belarus | 82.4 /100 | #150 | Excellent 96.3% |
| Hopi | 81.6 /100 | #151 | Excellent 96.3% |
| Immigrants | Russia | 78.4 /100 | #152 | Good 96.2% |
| Seminole | 78.1 /100 | #153 | Good 96.2% |
| Immigrants | Israel | 77.6 /100 | #154 | Good 96.2% |
| Immigrants | Jordan | 77.0 /100 | #155 | Good 96.2% |
| Kenyans | 76.2 /100 | #156 | Good 96.2% |
| Ugandans | 75.5 /100 | #157 | Good 96.2% |
| Arabs | 68.6 /100 | #158 | Good 96.2% |
| Alsatians | 67.2 /100 | #159 | Good 96.1% |
| Immigrants | Kenya | 66.8 /100 | #160 | Good 96.1% |
| Bermudans | 66.3 /100 | #161 | Good 96.1% |
| Pima | 64.3 /100 | #162 | Good 96.1% |