Armenian vs Immigrants from Jamaica 7th Grade
COMPARE
Armenian
Immigrants from Jamaica
7th Grade
7th Grade Comparison
Armenians
Immigrants from Jamaica
95.0%
7TH GRADE
0.1/ 100
METRIC RATING
284th/ 347
METRIC RANK
95.4%
7TH GRADE
0.9/ 100
METRIC RATING
251st/ 347
METRIC RANK
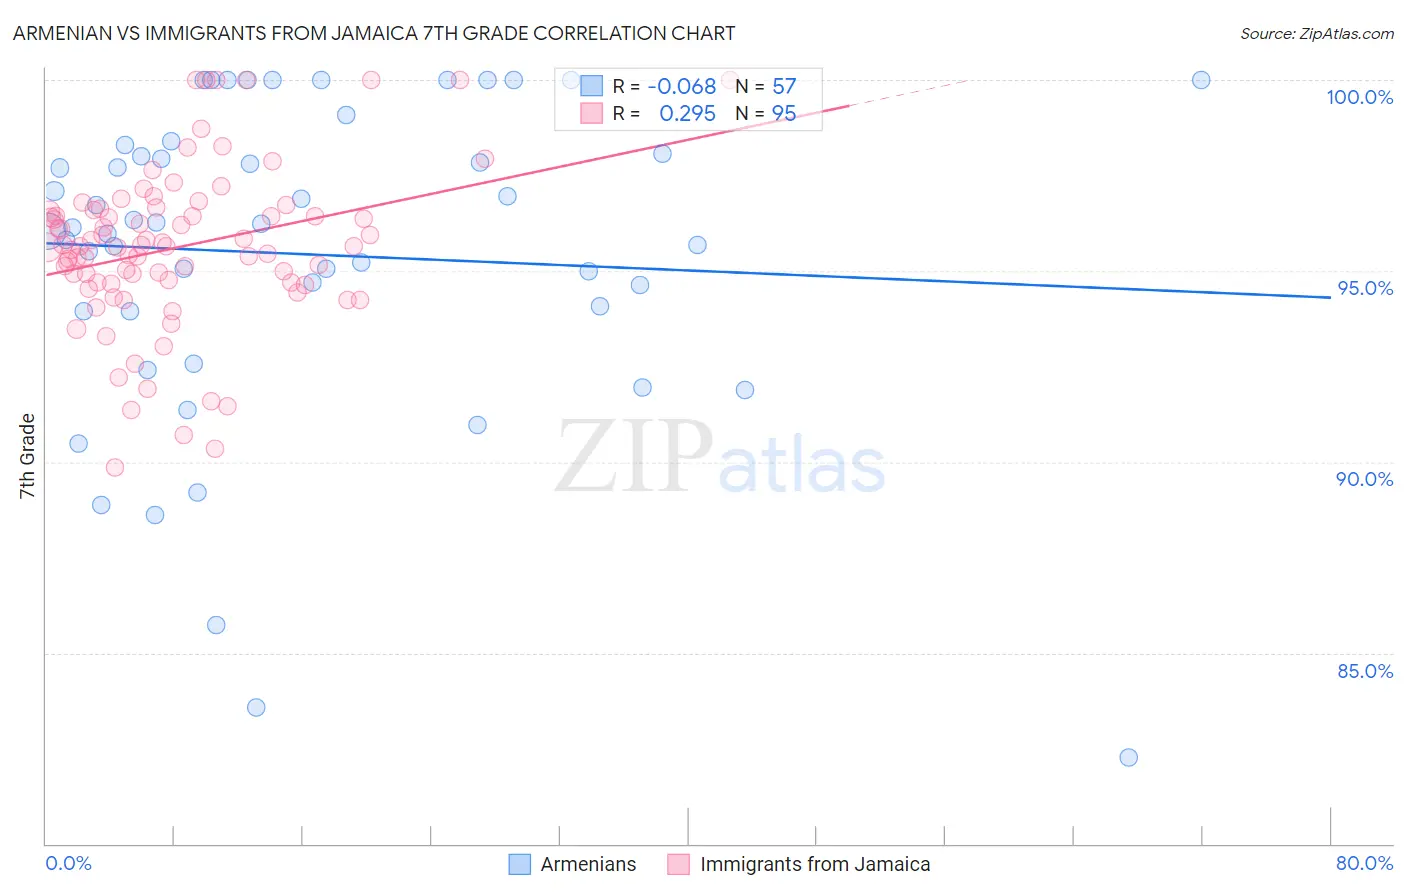
Armenian vs Immigrants from Jamaica 7th Grade Correlation Chart
The statistical analysis conducted on geographies consisting of 310,954,801 people shows a slight negative correlation between the proportion of Armenians and percentage of population with at least 7th grade education in the United States with a correlation coefficient (R) of -0.068 and weighted average of 95.0%. Similarly, the statistical analysis conducted on geographies consisting of 301,829,550 people shows a weak positive correlation between the proportion of Immigrants from Jamaica and percentage of population with at least 7th grade education in the United States with a correlation coefficient (R) of 0.295 and weighted average of 95.4%, a difference of 0.42%.
7th Grade Correlation Summary
| Measurement | Armenian | Immigrants from Jamaica |
| Minimum | 82.3% | 89.9% |
| Maximum | 100.0% | 100.0% |
| Range | 17.7% | 10.1% |
| Mean | 95.4% | 95.6% |
| Median | 96.1% | 95.6% |
| Interquartile 25% (IQ1) | 94.0% | 94.7% |
| Interquartile 75% (IQ3) | 98.2% | 96.6% |
| Interquartile Range (IQR) | 4.2% | 1.9% |
| Standard Deviation (Sample) | 4.1% | 2.1% |
| Standard Deviation (Population) | 4.1% | 2.1% |
Similar Demographics by 7th Grade
Demographics Similar to Armenians by 7th Grade
In terms of 7th grade, the demographic groups most similar to Armenians are Immigrants from Barbados (95.0%, a difference of 0.0%), Immigrants from Eritrea (94.9%, a difference of 0.010%), Immigrants from Bolivia (95.0%, a difference of 0.060%), Immigrants from St. Vincent and the Grenadines (95.0%, a difference of 0.070%), and Tohono O'odham (95.0%, a difference of 0.070%).
| Demographics | Rating | Rank | 7th Grade |
| Immigrants | Afghanistan | 0.2 /100 | #277 | Tragic 95.1% |
| Immigrants | Trinidad and Tobago | 0.1 /100 | #278 | Tragic 95.1% |
| Barbadians | 0.1 /100 | #279 | Tragic 95.1% |
| Immigrants | St. Vincent and the Grenadines | 0.1 /100 | #280 | Tragic 95.0% |
| Tohono O'odham | 0.1 /100 | #281 | Tragic 95.0% |
| Immigrants | Bolivia | 0.1 /100 | #282 | Tragic 95.0% |
| Immigrants | Barbados | 0.1 /100 | #283 | Tragic 95.0% |
| Armenians | 0.1 /100 | #284 | Tragic 95.0% |
| Immigrants | Eritrea | 0.1 /100 | #285 | Tragic 94.9% |
| Immigrants | Philippines | 0.0 /100 | #286 | Tragic 94.9% |
| Immigrants | Peru | 0.0 /100 | #287 | Tragic 94.9% |
| British West Indians | 0.0 /100 | #288 | Tragic 94.8% |
| Taiwanese | 0.0 /100 | #289 | Tragic 94.8% |
| Malaysians | 0.0 /100 | #290 | Tragic 94.8% |
| Immigrants | Grenada | 0.0 /100 | #291 | Tragic 94.8% |
Demographics Similar to Immigrants from Jamaica by 7th Grade
In terms of 7th grade, the demographic groups most similar to Immigrants from Jamaica are Immigrants from Cameroon (95.4%, a difference of 0.0%), Immigrants from Ethiopia (95.3%, a difference of 0.0%), Somali (95.3%, a difference of 0.010%), Bolivian (95.4%, a difference of 0.020%), and Colombian (95.3%, a difference of 0.020%).
| Demographics | Rating | Rank | 7th Grade |
| Uruguayans | 1.6 /100 | #244 | Tragic 95.4% |
| Immigrants | Middle Africa | 1.5 /100 | #245 | Tragic 95.4% |
| Ethiopians | 1.5 /100 | #246 | Tragic 95.4% |
| Tongans | 1.3 /100 | #247 | Tragic 95.4% |
| Paiute | 1.2 /100 | #248 | Tragic 95.4% |
| Bolivians | 1.1 /100 | #249 | Tragic 95.4% |
| Immigrants | Cameroon | 0.9 /100 | #250 | Tragic 95.4% |
| Immigrants | Jamaica | 0.9 /100 | #251 | Tragic 95.4% |
| Immigrants | Ethiopia | 0.9 /100 | #252 | Tragic 95.3% |
| Somalis | 0.9 /100 | #253 | Tragic 95.3% |
| Colombians | 0.8 /100 | #254 | Tragic 95.3% |
| Koreans | 0.8 /100 | #255 | Tragic 95.3% |
| Immigrants | China | 0.7 /100 | #256 | Tragic 95.3% |
| Immigrants | Congo | 0.7 /100 | #257 | Tragic 95.3% |
| Ghanaians | 0.7 /100 | #258 | Tragic 95.3% |