Immigrants from Kenya vs Immigrants from Japan Nursery School
COMPARE
Immigrants from Kenya
Immigrants from Japan
Nursery School
Nursery School Comparison
Immigrants from Kenya
Immigrants from Japan
97.9%
NURSERY SCHOOL
24.1/ 100
METRIC RATING
198th/ 347
METRIC RANK
98.2%
NURSERY SCHOOL
94.0/ 100
METRIC RATING
122nd/ 347
METRIC RANK
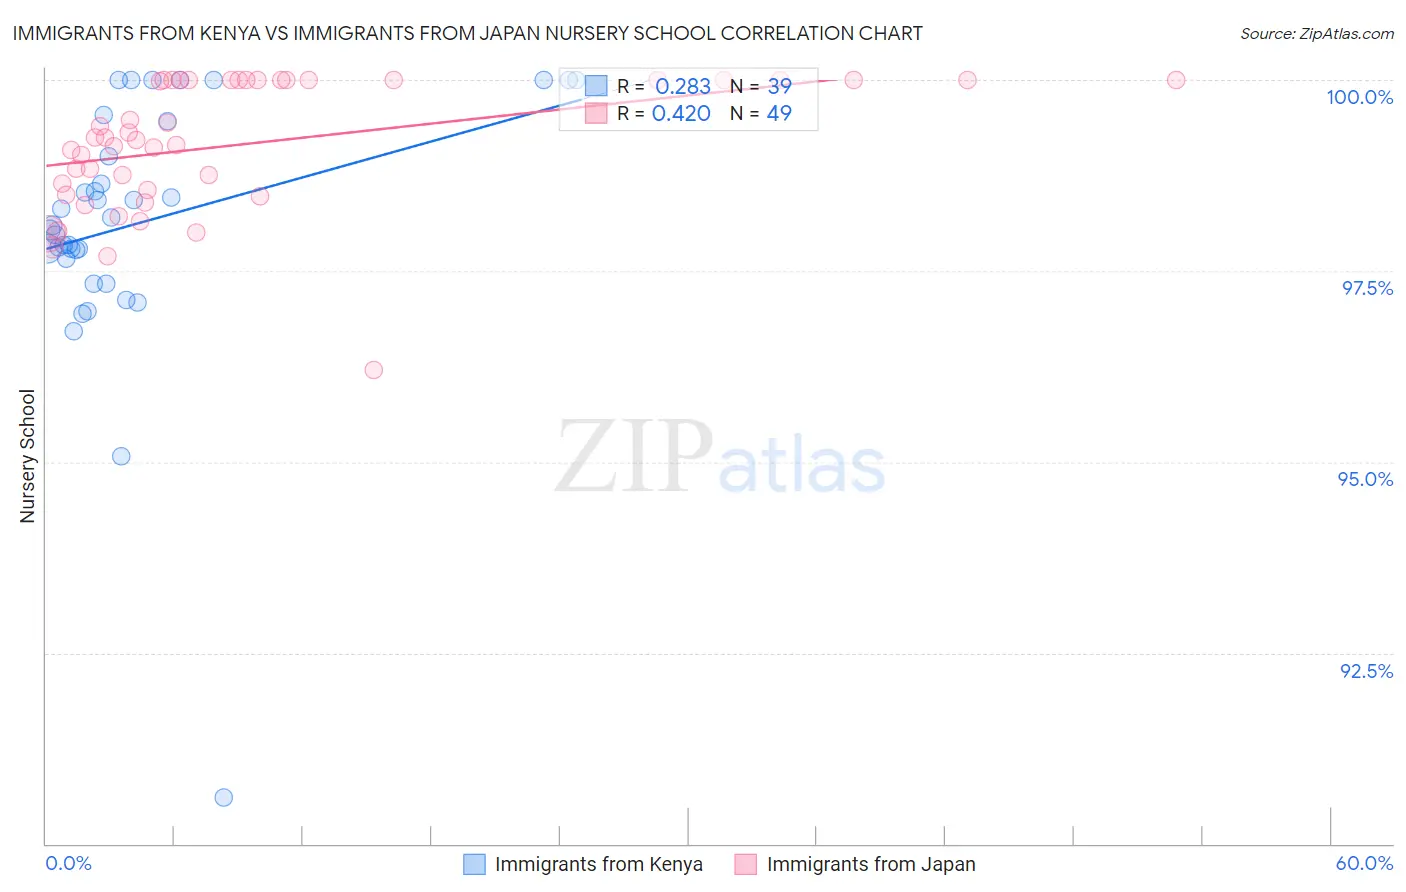
Immigrants from Kenya vs Immigrants from Japan Nursery School Correlation Chart
The statistical analysis conducted on geographies consisting of 218,076,690 people shows a weak positive correlation between the proportion of Immigrants from Kenya and percentage of population with at least nursery school education in the United States with a correlation coefficient (R) of 0.283 and weighted average of 97.9%. Similarly, the statistical analysis conducted on geographies consisting of 340,149,128 people shows a moderate positive correlation between the proportion of Immigrants from Japan and percentage of population with at least nursery school education in the United States with a correlation coefficient (R) of 0.420 and weighted average of 98.2%, a difference of 0.29%.
Nursery School Correlation Summary
| Measurement | Immigrants from Kenya | Immigrants from Japan |
| Minimum | 90.6% | 96.2% |
| Maximum | 100.0% | 100.0% |
| Range | 9.4% | 3.8% |
| Mean | 98.1% | 99.2% |
| Median | 98.1% | 99.2% |
| Interquartile 25% (IQ1) | 97.7% | 98.5% |
| Interquartile 75% (IQ3) | 99.5% | 100.0% |
| Interquartile Range (IQR) | 1.8% | 1.5% |
| Standard Deviation (Sample) | 1.7% | 0.86% |
| Standard Deviation (Population) | 1.7% | 0.85% |
Similar Demographics by Nursery School
Demographics Similar to Immigrants from Kenya by Nursery School
In terms of nursery school, the demographic groups most similar to Immigrants from Kenya are Paraguayan (97.9%, a difference of 0.010%), Mongolian (97.9%, a difference of 0.010%), Hawaiian (97.9%, a difference of 0.010%), Guamanian/Chamorro (97.9%, a difference of 0.010%), and Yuman (97.9%, a difference of 0.010%).
| Demographics | Rating | Rank | Nursery School |
| Immigrants | Taiwan | 30.6 /100 | #191 | Fair 97.9% |
| Blacks/African Americans | 29.4 /100 | #192 | Fair 97.9% |
| Paraguayans | 27.4 /100 | #193 | Fair 97.9% |
| Mongolians | 27.3 /100 | #194 | Fair 97.9% |
| Hawaiians | 27.2 /100 | #195 | Fair 97.9% |
| Guamanians/Chamorros | 25.7 /100 | #196 | Fair 97.9% |
| Yuman | 25.7 /100 | #197 | Fair 97.9% |
| Immigrants | Kenya | 24.1 /100 | #198 | Fair 97.9% |
| Immigrants | Egypt | 22.5 /100 | #199 | Fair 97.9% |
| Tohono O'odham | 22.2 /100 | #200 | Fair 97.9% |
| Immigrants | Lebanon | 21.2 /100 | #201 | Fair 97.9% |
| Immigrants | Ukraine | 19.9 /100 | #202 | Poor 97.9% |
| Immigrants | Uganda | 18.0 /100 | #203 | Poor 97.9% |
| Immigrants | Southern Europe | 17.4 /100 | #204 | Poor 97.9% |
| Immigrants | Chile | 17.3 /100 | #205 | Poor 97.9% |
Demographics Similar to Immigrants from Japan by Nursery School
In terms of nursery school, the demographic groups most similar to Immigrants from Japan are Immigrants from Zimbabwe (98.2%, a difference of 0.0%), Syrian (98.2%, a difference of 0.0%), Lebanese (98.2%, a difference of 0.0%), Iroquois (98.2%, a difference of 0.0%), and Okinawan (98.2%, a difference of 0.010%).
| Demographics | Rating | Rank | Nursery School |
| Iranians | 96.3 /100 | #115 | Exceptional 98.2% |
| Spanish | 95.8 /100 | #116 | Exceptional 98.2% |
| Immigrants | France | 95.6 /100 | #117 | Exceptional 98.2% |
| Yugoslavians | 95.4 /100 | #118 | Exceptional 98.2% |
| Thais | 95.0 /100 | #119 | Exceptional 98.2% |
| Okinawans | 94.5 /100 | #120 | Exceptional 98.2% |
| Immigrants | Zimbabwe | 94.2 /100 | #121 | Exceptional 98.2% |
| Immigrants | Japan | 94.0 /100 | #122 | Exceptional 98.2% |
| Syrians | 93.9 /100 | #123 | Exceptional 98.2% |
| Lebanese | 93.8 /100 | #124 | Exceptional 98.2% |
| Iroquois | 93.7 /100 | #125 | Exceptional 98.2% |
| Menominee | 93.6 /100 | #126 | Exceptional 98.2% |
| Immigrants | Saudi Arabia | 93.4 /100 | #127 | Exceptional 98.2% |
| Immigrants | Serbia | 92.4 /100 | #128 | Exceptional 98.2% |
| Cambodians | 91.4 /100 | #129 | Exceptional 98.2% |