Arapaho vs Immigrants from Senegal 11th Grade
COMPARE
Arapaho
Immigrants from Senegal
11th Grade
11th Grade Comparison
Arapaho
Immigrants from Senegal
92.4%
11TH GRADE
35.1/ 100
METRIC RATING
186th/ 347
METRIC RANK
91.4%
11TH GRADE
0.7/ 100
METRIC RATING
256th/ 347
METRIC RANK
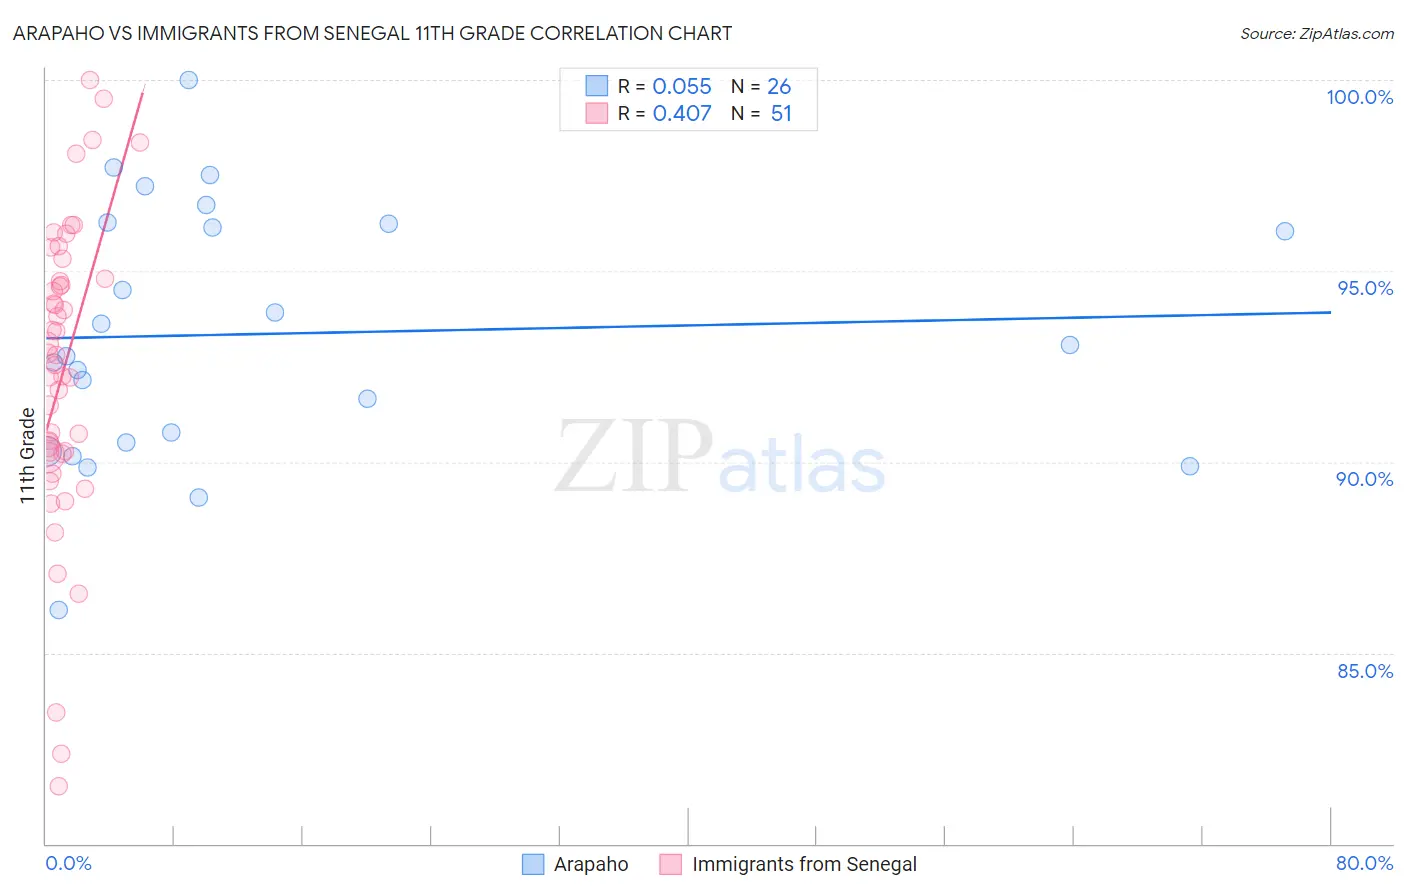
Arapaho vs Immigrants from Senegal 11th Grade Correlation Chart
The statistical analysis conducted on geographies consisting of 29,780,040 people shows a slight positive correlation between the proportion of Arapaho and percentage of population with at least 11th grade education in the United States with a correlation coefficient (R) of 0.055 and weighted average of 92.4%. Similarly, the statistical analysis conducted on geographies consisting of 90,129,421 people shows a moderate positive correlation between the proportion of Immigrants from Senegal and percentage of population with at least 11th grade education in the United States with a correlation coefficient (R) of 0.407 and weighted average of 91.4%, a difference of 1.1%.
11th Grade Correlation Summary
| Measurement | Arapaho | Immigrants from Senegal |
| Minimum | 86.1% | 81.5% |
| Maximum | 100.0% | 100.0% |
| Range | 13.9% | 18.5% |
| Mean | 93.4% | 92.4% |
| Median | 92.9% | 92.8% |
| Interquartile 25% (IQ1) | 90.5% | 90.2% |
| Interquartile 75% (IQ3) | 96.2% | 94.8% |
| Interquartile Range (IQR) | 5.7% | 4.6% |
| Standard Deviation (Sample) | 3.3% | 4.0% |
| Standard Deviation (Population) | 3.3% | 4.0% |
Similar Demographics by 11th Grade
Demographics Similar to Arapaho by 11th Grade
In terms of 11th grade, the demographic groups most similar to Arapaho are Immigrants from Western Asia (92.4%, a difference of 0.0%), Immigrants from Nepal (92.4%, a difference of 0.010%), Immigrants from Asia (92.4%, a difference of 0.020%), Immigrants from Indonesia (92.4%, a difference of 0.020%), and Immigrants from Chile (92.4%, a difference of 0.020%).
| Demographics | Rating | Rank | 11th Grade |
| Creek | 40.9 /100 | #179 | Average 92.4% |
| Inupiat | 40.7 /100 | #180 | Average 92.4% |
| Cherokee | 40.7 /100 | #181 | Average 92.4% |
| Immigrants | Morocco | 38.6 /100 | #182 | Fair 92.4% |
| Immigrants | Malaysia | 37.6 /100 | #183 | Fair 92.4% |
| Immigrants | Asia | 37.4 /100 | #184 | Fair 92.4% |
| Immigrants | Nepal | 36.4 /100 | #185 | Fair 92.4% |
| Arapaho | 35.1 /100 | #186 | Fair 92.4% |
| Immigrants | Western Asia | 35.0 /100 | #187 | Fair 92.4% |
| Immigrants | Indonesia | 33.7 /100 | #188 | Fair 92.4% |
| Immigrants | Chile | 33.3 /100 | #189 | Fair 92.4% |
| Chickasaw | 31.4 /100 | #190 | Fair 92.3% |
| French American Indians | 30.8 /100 | #191 | Fair 92.3% |
| Immigrants | Syria | 30.4 /100 | #192 | Fair 92.3% |
| Moroccans | 28.7 /100 | #193 | Fair 92.3% |
Demographics Similar to Immigrants from Senegal by 11th Grade
In terms of 11th grade, the demographic groups most similar to Immigrants from Senegal are Immigrants from Eritrea (91.4%, a difference of 0.010%), Black/African American (91.4%, a difference of 0.010%), Cajun (91.4%, a difference of 0.010%), Immigrants from South America (91.4%, a difference of 0.030%), and Immigrants from Colombia (91.4%, a difference of 0.030%).
| Demographics | Rating | Rank | 11th Grade |
| Peruvians | 1.0 /100 | #249 | Tragic 91.5% |
| Ghanaians | 0.9 /100 | #250 | Tragic 91.5% |
| Immigrants | Costa Rica | 0.9 /100 | #251 | Tragic 91.4% |
| Immigrants | Nigeria | 0.8 /100 | #252 | Tragic 91.4% |
| Immigrants | South America | 0.8 /100 | #253 | Tragic 91.4% |
| Immigrants | Eritrea | 0.7 /100 | #254 | Tragic 91.4% |
| Blacks/African Americans | 0.7 /100 | #255 | Tragic 91.4% |
| Immigrants | Senegal | 0.7 /100 | #256 | Tragic 91.4% |
| Cajuns | 0.7 /100 | #257 | Tragic 91.4% |
| Immigrants | Colombia | 0.6 /100 | #258 | Tragic 91.4% |
| Jamaicans | 0.6 /100 | #259 | Tragic 91.4% |
| Spanish Americans | 0.6 /100 | #260 | Tragic 91.4% |
| Taiwanese | 0.6 /100 | #261 | Tragic 91.3% |
| Immigrants | Uruguay | 0.5 /100 | #262 | Tragic 91.3% |
| Immigrants | Ghana | 0.3 /100 | #263 | Tragic 91.2% |