Immigrants from Canada vs Immigrants from Senegal 11th Grade
COMPARE
Immigrants from Canada
Immigrants from Senegal
11th Grade
11th Grade Comparison
Immigrants from Canada
Immigrants from Senegal
94.0%
11TH GRADE
99.9/ 100
METRIC RATING
52nd/ 347
METRIC RANK
91.4%
11TH GRADE
0.7/ 100
METRIC RATING
256th/ 347
METRIC RANK
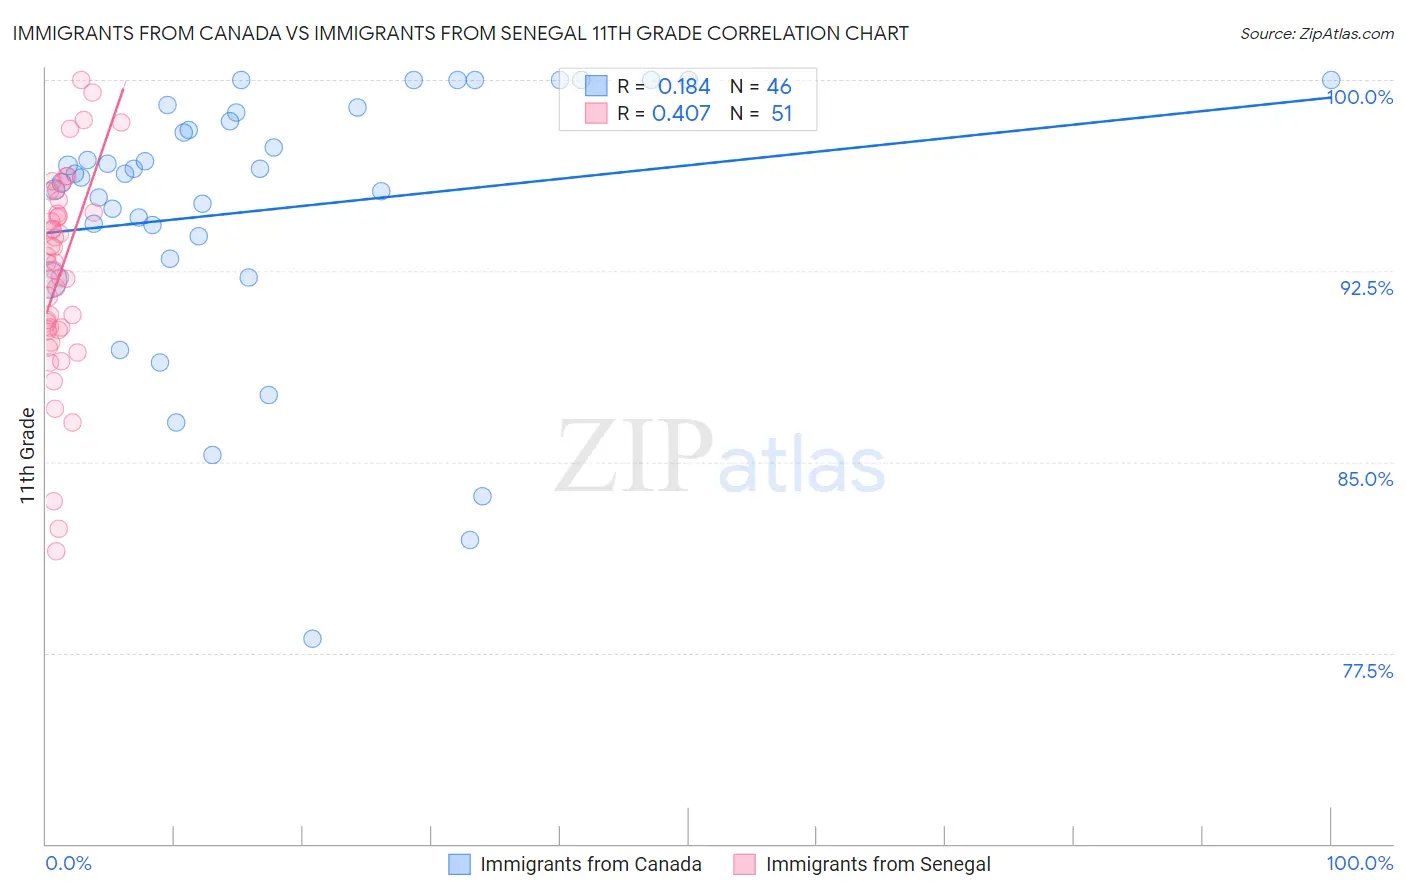
Immigrants from Canada vs Immigrants from Senegal 11th Grade Correlation Chart
The statistical analysis conducted on geographies consisting of 459,397,067 people shows a poor positive correlation between the proportion of Immigrants from Canada and percentage of population with at least 11th grade education in the United States with a correlation coefficient (R) of 0.184 and weighted average of 94.0%. Similarly, the statistical analysis conducted on geographies consisting of 90,129,421 people shows a moderate positive correlation between the proportion of Immigrants from Senegal and percentage of population with at least 11th grade education in the United States with a correlation coefficient (R) of 0.407 and weighted average of 91.4%, a difference of 2.9%.
11th Grade Correlation Summary
| Measurement | Immigrants from Canada | Immigrants from Senegal |
| Minimum | 78.1% | 81.5% |
| Maximum | 100.0% | 100.0% |
| Range | 21.9% | 18.5% |
| Mean | 94.9% | 92.4% |
| Median | 96.3% | 92.8% |
| Interquartile 25% (IQ1) | 93.9% | 90.2% |
| Interquartile 75% (IQ3) | 98.7% | 94.8% |
| Interquartile Range (IQR) | 4.9% | 4.6% |
| Standard Deviation (Sample) | 5.2% | 4.0% |
| Standard Deviation (Population) | 5.2% | 4.0% |
Similar Demographics by 11th Grade
Demographics Similar to Immigrants from Canada by 11th Grade
In terms of 11th grade, the demographic groups most similar to Immigrants from Canada are Turkish (94.0%, a difference of 0.010%), Immigrants from Australia (94.0%, a difference of 0.010%), Immigrants from North America (94.0%, a difference of 0.020%), Czechoslovakian (94.0%, a difference of 0.020%), and French Canadian (94.0%, a difference of 0.030%).
| Demographics | Rating | Rank | 11th Grade |
| Australians | 99.9 /100 | #45 | Exceptional 94.1% |
| Serbians | 99.9 /100 | #46 | Exceptional 94.1% |
| Filipinos | 99.9 /100 | #47 | Exceptional 94.1% |
| Macedonians | 99.9 /100 | #48 | Exceptional 94.1% |
| Slavs | 99.9 /100 | #49 | Exceptional 94.1% |
| French | 99.9 /100 | #50 | Exceptional 94.1% |
| Turks | 99.9 /100 | #51 | Exceptional 94.0% |
| Immigrants | Canada | 99.9 /100 | #52 | Exceptional 94.0% |
| Immigrants | Australia | 99.9 /100 | #53 | Exceptional 94.0% |
| Immigrants | North America | 99.9 /100 | #54 | Exceptional 94.0% |
| Czechoslovakians | 99.9 /100 | #55 | Exceptional 94.0% |
| French Canadians | 99.9 /100 | #56 | Exceptional 94.0% |
| New Zealanders | 99.9 /100 | #57 | Exceptional 94.0% |
| Iranians | 99.9 /100 | #58 | Exceptional 94.0% |
| Bhutanese | 99.8 /100 | #59 | Exceptional 94.0% |
Demographics Similar to Immigrants from Senegal by 11th Grade
In terms of 11th grade, the demographic groups most similar to Immigrants from Senegal are Immigrants from Eritrea (91.4%, a difference of 0.010%), Black/African American (91.4%, a difference of 0.010%), Cajun (91.4%, a difference of 0.010%), Immigrants from South America (91.4%, a difference of 0.030%), and Immigrants from Colombia (91.4%, a difference of 0.030%).
| Demographics | Rating | Rank | 11th Grade |
| Peruvians | 1.0 /100 | #249 | Tragic 91.5% |
| Ghanaians | 0.9 /100 | #250 | Tragic 91.5% |
| Immigrants | Costa Rica | 0.9 /100 | #251 | Tragic 91.4% |
| Immigrants | Nigeria | 0.8 /100 | #252 | Tragic 91.4% |
| Immigrants | South America | 0.8 /100 | #253 | Tragic 91.4% |
| Immigrants | Eritrea | 0.7 /100 | #254 | Tragic 91.4% |
| Blacks/African Americans | 0.7 /100 | #255 | Tragic 91.4% |
| Immigrants | Senegal | 0.7 /100 | #256 | Tragic 91.4% |
| Cajuns | 0.7 /100 | #257 | Tragic 91.4% |
| Immigrants | Colombia | 0.6 /100 | #258 | Tragic 91.4% |
| Jamaicans | 0.6 /100 | #259 | Tragic 91.4% |
| Spanish Americans | 0.6 /100 | #260 | Tragic 91.4% |
| Taiwanese | 0.6 /100 | #261 | Tragic 91.3% |
| Immigrants | Uruguay | 0.5 /100 | #262 | Tragic 91.3% |
| Immigrants | Ghana | 0.3 /100 | #263 | Tragic 91.2% |