Arapaho vs Aleut 11th Grade
COMPARE
Arapaho
Aleut
11th Grade
11th Grade Comparison
Arapaho
Aleuts
92.4%
11TH GRADE
35.1/ 100
METRIC RATING
186th/ 347
METRIC RANK
93.7%
11TH GRADE
99.5/ 100
METRIC RATING
77th/ 347
METRIC RANK
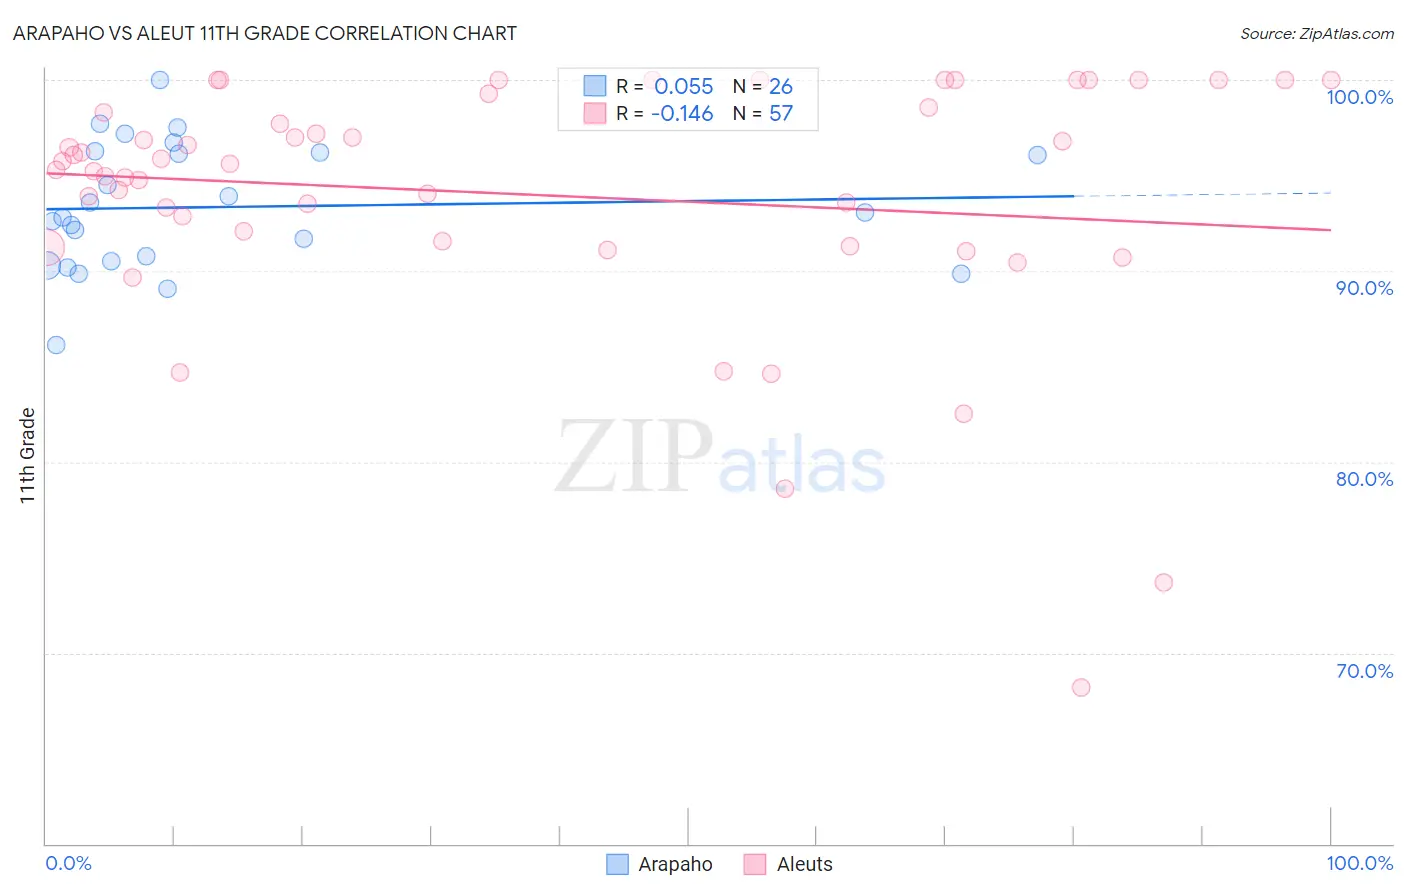
Arapaho vs Aleut 11th Grade Correlation Chart
The statistical analysis conducted on geographies consisting of 29,780,040 people shows a slight positive correlation between the proportion of Arapaho and percentage of population with at least 11th grade education in the United States with a correlation coefficient (R) of 0.055 and weighted average of 92.4%. Similarly, the statistical analysis conducted on geographies consisting of 61,782,880 people shows a poor negative correlation between the proportion of Aleuts and percentage of population with at least 11th grade education in the United States with a correlation coefficient (R) of -0.146 and weighted average of 93.7%, a difference of 1.5%.
11th Grade Correlation Summary
| Measurement | Arapaho | Aleut |
| Minimum | 86.1% | 68.2% |
| Maximum | 100.0% | 100.0% |
| Range | 13.9% | 31.8% |
| Mean | 93.4% | 94.0% |
| Median | 92.9% | 95.6% |
| Interquartile 25% (IQ1) | 90.5% | 91.4% |
| Interquartile 75% (IQ3) | 96.2% | 98.9% |
| Interquartile Range (IQR) | 5.7% | 7.5% |
| Standard Deviation (Sample) | 3.3% | 6.6% |
| Standard Deviation (Population) | 3.3% | 6.5% |
Similar Demographics by 11th Grade
Demographics Similar to Arapaho by 11th Grade
In terms of 11th grade, the demographic groups most similar to Arapaho are Immigrants from Western Asia (92.4%, a difference of 0.0%), Immigrants from Nepal (92.4%, a difference of 0.010%), Immigrants from Asia (92.4%, a difference of 0.020%), Immigrants from Indonesia (92.4%, a difference of 0.020%), and Immigrants from Chile (92.4%, a difference of 0.020%).
| Demographics | Rating | Rank | 11th Grade |
| Creek | 40.9 /100 | #179 | Average 92.4% |
| Inupiat | 40.7 /100 | #180 | Average 92.4% |
| Cherokee | 40.7 /100 | #181 | Average 92.4% |
| Immigrants | Morocco | 38.6 /100 | #182 | Fair 92.4% |
| Immigrants | Malaysia | 37.6 /100 | #183 | Fair 92.4% |
| Immigrants | Asia | 37.4 /100 | #184 | Fair 92.4% |
| Immigrants | Nepal | 36.4 /100 | #185 | Fair 92.4% |
| Arapaho | 35.1 /100 | #186 | Fair 92.4% |
| Immigrants | Western Asia | 35.0 /100 | #187 | Fair 92.4% |
| Immigrants | Indonesia | 33.7 /100 | #188 | Fair 92.4% |
| Immigrants | Chile | 33.3 /100 | #189 | Fair 92.4% |
| Chickasaw | 31.4 /100 | #190 | Fair 92.3% |
| French American Indians | 30.8 /100 | #191 | Fair 92.3% |
| Immigrants | Syria | 30.4 /100 | #192 | Fair 92.3% |
| Moroccans | 28.7 /100 | #193 | Fair 92.3% |
Demographics Similar to Aleuts by 11th Grade
In terms of 11th grade, the demographic groups most similar to Aleuts are Celtic (93.7%, a difference of 0.0%), Soviet Union (93.7%, a difference of 0.0%), Immigrants from Denmark (93.7%, a difference of 0.010%), Immigrants from Latvia (93.8%, a difference of 0.030%), and Canadian (93.7%, a difference of 0.030%).
| Demographics | Rating | Rank | 11th Grade |
| Immigrants | England | 99.7 /100 | #70 | Exceptional 93.8% |
| Immigrants | South Africa | 99.7 /100 | #71 | Exceptional 93.8% |
| Immigrants | Japan | 99.7 /100 | #72 | Exceptional 93.8% |
| Romanians | 99.6 /100 | #73 | Exceptional 93.8% |
| Immigrants | Czechoslovakia | 99.6 /100 | #74 | Exceptional 93.8% |
| Immigrants | Latvia | 99.6 /100 | #75 | Exceptional 93.8% |
| Celtics | 99.5 /100 | #76 | Exceptional 93.7% |
| Aleuts | 99.5 /100 | #77 | Exceptional 93.7% |
| Soviet Union | 99.5 /100 | #78 | Exceptional 93.7% |
| Immigrants | Denmark | 99.5 /100 | #79 | Exceptional 93.7% |
| Canadians | 99.5 /100 | #80 | Exceptional 93.7% |
| Immigrants | Moldova | 99.5 /100 | #81 | Exceptional 93.7% |
| Immigrants | Saudi Arabia | 99.3 /100 | #82 | Exceptional 93.7% |
| Icelanders | 99.3 /100 | #83 | Exceptional 93.6% |
| Immigrants | Taiwan | 99.3 /100 | #84 | Exceptional 93.6% |