Immigrants from Panama vs Immigrants from Senegal 11th Grade
COMPARE
Immigrants from Panama
Immigrants from Senegal
11th Grade
11th Grade Comparison
Immigrants from Panama
Immigrants from Senegal
91.8%
11TH GRADE
4.3/ 100
METRIC RATING
228th/ 347
METRIC RANK
91.4%
11TH GRADE
0.7/ 100
METRIC RATING
256th/ 347
METRIC RANK
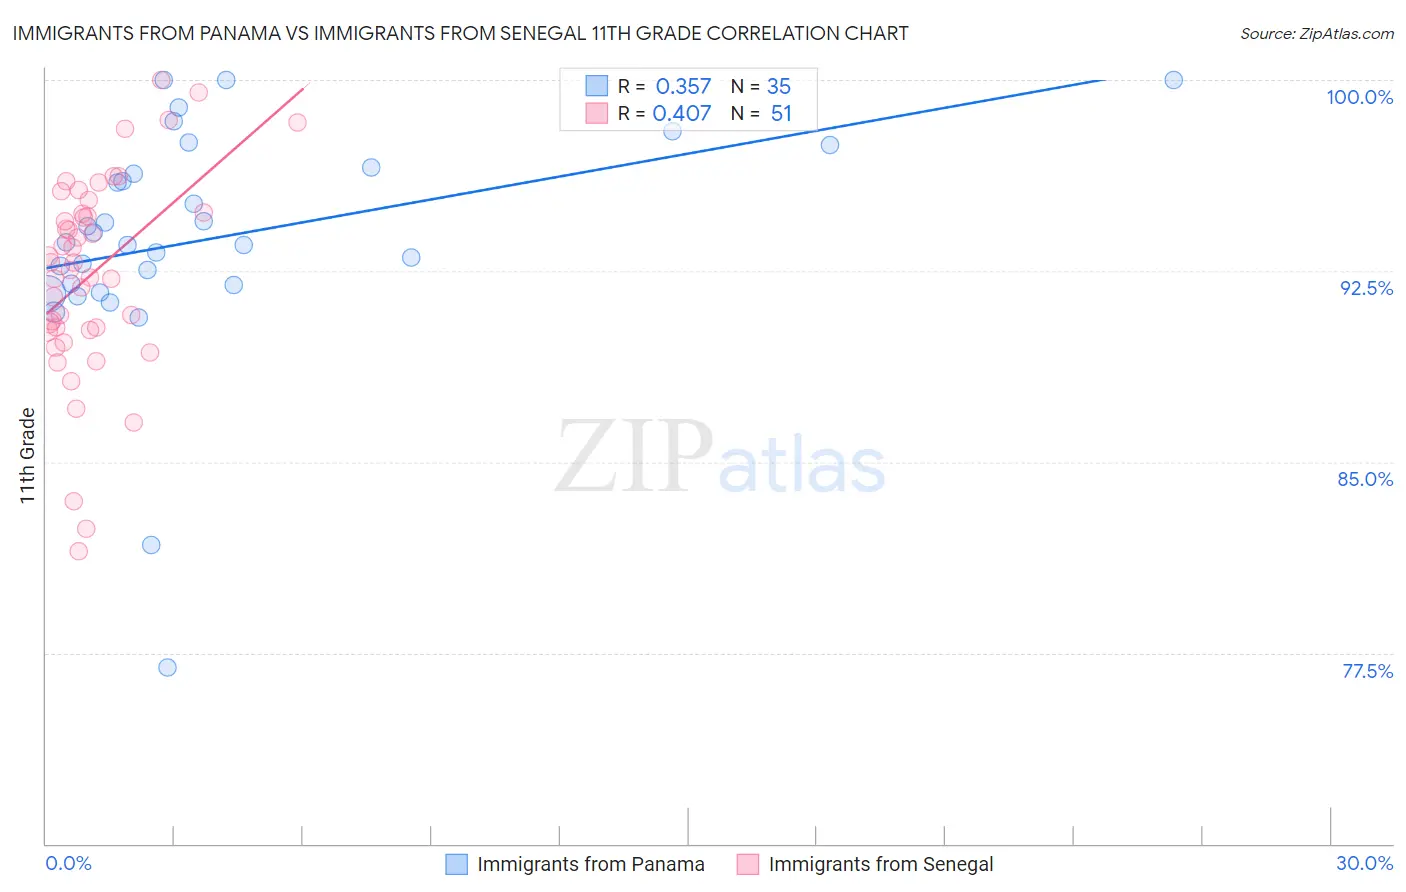
Immigrants from Panama vs Immigrants from Senegal 11th Grade Correlation Chart
The statistical analysis conducted on geographies consisting of 221,183,192 people shows a mild positive correlation between the proportion of Immigrants from Panama and percentage of population with at least 11th grade education in the United States with a correlation coefficient (R) of 0.357 and weighted average of 91.8%. Similarly, the statistical analysis conducted on geographies consisting of 90,129,421 people shows a moderate positive correlation between the proportion of Immigrants from Senegal and percentage of population with at least 11th grade education in the United States with a correlation coefficient (R) of 0.407 and weighted average of 91.4%, a difference of 0.46%.
11th Grade Correlation Summary
| Measurement | Immigrants from Panama | Immigrants from Senegal |
| Minimum | 76.9% | 81.5% |
| Maximum | 100.0% | 100.0% |
| Range | 23.1% | 18.5% |
| Mean | 93.8% | 92.4% |
| Median | 93.6% | 92.8% |
| Interquartile 25% (IQ1) | 91.9% | 90.2% |
| Interquartile 75% (IQ3) | 96.5% | 94.8% |
| Interquartile Range (IQR) | 4.6% | 4.6% |
| Standard Deviation (Sample) | 4.6% | 4.0% |
| Standard Deviation (Population) | 4.5% | 4.0% |
Similar Demographics by 11th Grade
Demographics Similar to Immigrants from Panama by 11th Grade
In terms of 11th grade, the demographic groups most similar to Immigrants from Panama are Immigrants from Cameroon (91.8%, a difference of 0.0%), Nigerian (91.8%, a difference of 0.0%), Immigrants from Afghanistan (91.8%, a difference of 0.030%), Choctaw (91.8%, a difference of 0.040%), and Immigrants from Somalia (91.9%, a difference of 0.050%).
| Demographics | Rating | Rank | 11th Grade |
| Immigrants | Liberia | 7.0 /100 | #221 | Tragic 91.9% |
| Immigrants | Africa | 6.5 /100 | #222 | Tragic 91.9% |
| Immigrants | Bahamas | 6.5 /100 | #223 | Tragic 91.9% |
| Costa Ricans | 6.3 /100 | #224 | Tragic 91.9% |
| Immigrants | Zaire | 5.4 /100 | #225 | Tragic 91.9% |
| Immigrants | Somalia | 5.2 /100 | #226 | Tragic 91.9% |
| Immigrants | Cameroon | 4.4 /100 | #227 | Tragic 91.8% |
| Immigrants | Panama | 4.3 /100 | #228 | Tragic 91.8% |
| Nigerians | 4.3 /100 | #229 | Tragic 91.8% |
| Immigrants | Afghanistan | 3.9 /100 | #230 | Tragic 91.8% |
| Choctaw | 3.7 /100 | #231 | Tragic 91.8% |
| Uruguayans | 3.5 /100 | #232 | Tragic 91.8% |
| Cheyenne | 3.3 /100 | #233 | Tragic 91.8% |
| Armenians | 2.9 /100 | #234 | Tragic 91.7% |
| Sub-Saharan Africans | 2.9 /100 | #235 | Tragic 91.7% |
Demographics Similar to Immigrants from Senegal by 11th Grade
In terms of 11th grade, the demographic groups most similar to Immigrants from Senegal are Immigrants from Eritrea (91.4%, a difference of 0.010%), Black/African American (91.4%, a difference of 0.010%), Cajun (91.4%, a difference of 0.010%), Immigrants from South America (91.4%, a difference of 0.030%), and Immigrants from Colombia (91.4%, a difference of 0.030%).
| Demographics | Rating | Rank | 11th Grade |
| Peruvians | 1.0 /100 | #249 | Tragic 91.5% |
| Ghanaians | 0.9 /100 | #250 | Tragic 91.5% |
| Immigrants | Costa Rica | 0.9 /100 | #251 | Tragic 91.4% |
| Immigrants | Nigeria | 0.8 /100 | #252 | Tragic 91.4% |
| Immigrants | South America | 0.8 /100 | #253 | Tragic 91.4% |
| Immigrants | Eritrea | 0.7 /100 | #254 | Tragic 91.4% |
| Blacks/African Americans | 0.7 /100 | #255 | Tragic 91.4% |
| Immigrants | Senegal | 0.7 /100 | #256 | Tragic 91.4% |
| Cajuns | 0.7 /100 | #257 | Tragic 91.4% |
| Immigrants | Colombia | 0.6 /100 | #258 | Tragic 91.4% |
| Jamaicans | 0.6 /100 | #259 | Tragic 91.4% |
| Spanish Americans | 0.6 /100 | #260 | Tragic 91.4% |
| Taiwanese | 0.6 /100 | #261 | Tragic 91.3% |
| Immigrants | Uruguay | 0.5 /100 | #262 | Tragic 91.3% |
| Immigrants | Ghana | 0.3 /100 | #263 | Tragic 91.2% |