Arapaho vs French Canadian 11th Grade
COMPARE
Arapaho
French Canadian
11th Grade
11th Grade Comparison
Arapaho
French Canadians
92.4%
11TH GRADE
35.1/ 100
METRIC RATING
186th/ 347
METRIC RANK
94.0%
11TH GRADE
99.9/ 100
METRIC RATING
56th/ 347
METRIC RANK
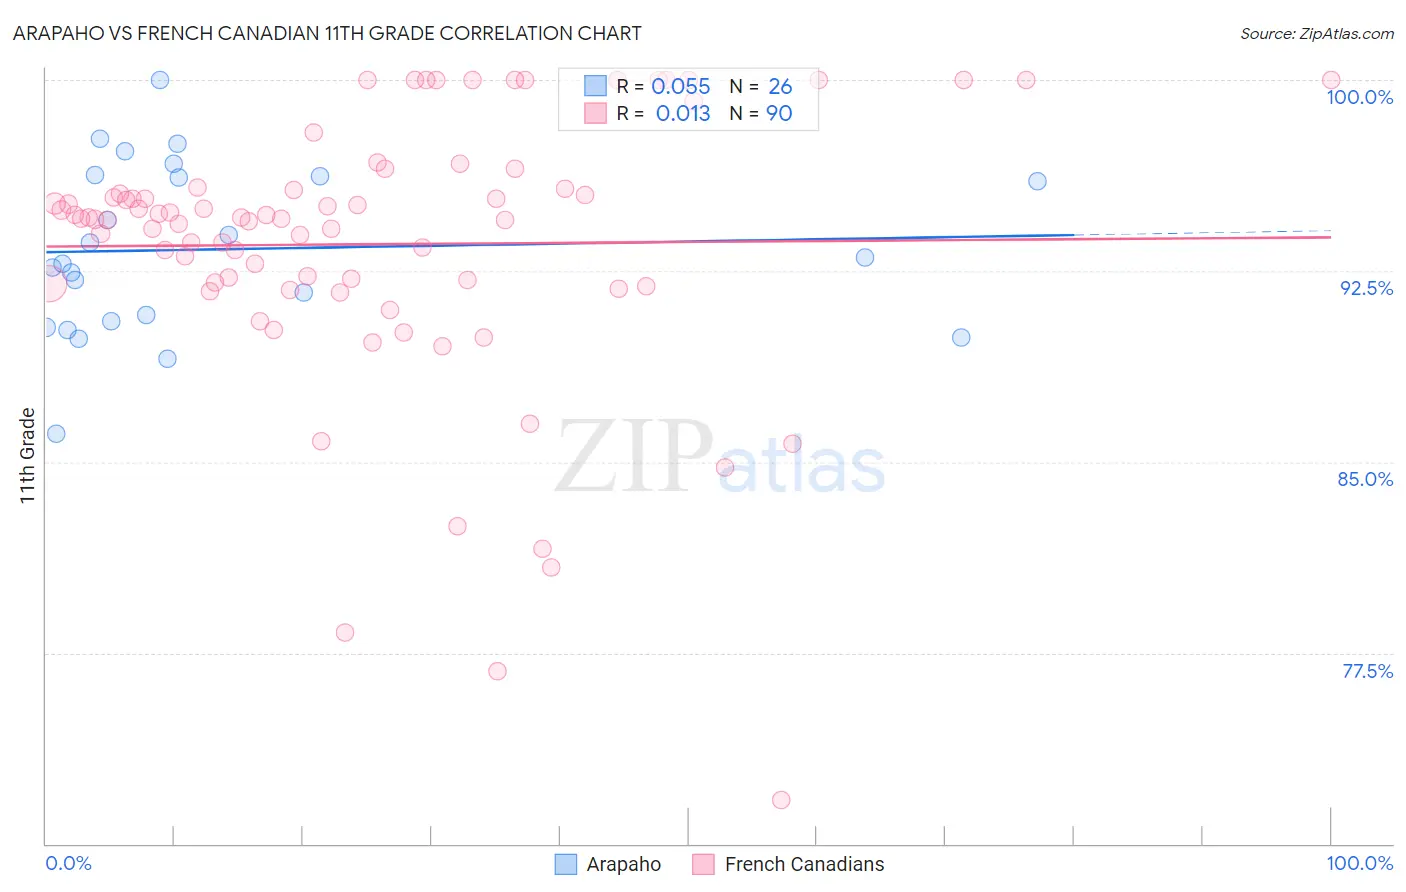
Arapaho vs French Canadian 11th Grade Correlation Chart
The statistical analysis conducted on geographies consisting of 29,780,040 people shows a slight positive correlation between the proportion of Arapaho and percentage of population with at least 11th grade education in the United States with a correlation coefficient (R) of 0.055 and weighted average of 92.4%. Similarly, the statistical analysis conducted on geographies consisting of 502,678,553 people shows no correlation between the proportion of French Canadians and percentage of population with at least 11th grade education in the United States with a correlation coefficient (R) of 0.013 and weighted average of 94.0%, a difference of 1.8%.
11th Grade Correlation Summary
| Measurement | Arapaho | French Canadian |
| Minimum | 86.1% | 71.7% |
| Maximum | 100.0% | 100.0% |
| Range | 13.9% | 28.3% |
| Mean | 93.4% | 93.6% |
| Median | 92.9% | 94.6% |
| Interquartile 25% (IQ1) | 90.5% | 92.0% |
| Interquartile 75% (IQ3) | 96.2% | 95.7% |
| Interquartile Range (IQR) | 5.7% | 3.7% |
| Standard Deviation (Sample) | 3.3% | 5.4% |
| Standard Deviation (Population) | 3.3% | 5.3% |
Similar Demographics by 11th Grade
Demographics Similar to Arapaho by 11th Grade
In terms of 11th grade, the demographic groups most similar to Arapaho are Immigrants from Western Asia (92.4%, a difference of 0.0%), Immigrants from Nepal (92.4%, a difference of 0.010%), Immigrants from Asia (92.4%, a difference of 0.020%), Immigrants from Indonesia (92.4%, a difference of 0.020%), and Immigrants from Chile (92.4%, a difference of 0.020%).
| Demographics | Rating | Rank | 11th Grade |
| Creek | 40.9 /100 | #179 | Average 92.4% |
| Inupiat | 40.7 /100 | #180 | Average 92.4% |
| Cherokee | 40.7 /100 | #181 | Average 92.4% |
| Immigrants | Morocco | 38.6 /100 | #182 | Fair 92.4% |
| Immigrants | Malaysia | 37.6 /100 | #183 | Fair 92.4% |
| Immigrants | Asia | 37.4 /100 | #184 | Fair 92.4% |
| Immigrants | Nepal | 36.4 /100 | #185 | Fair 92.4% |
| Arapaho | 35.1 /100 | #186 | Fair 92.4% |
| Immigrants | Western Asia | 35.0 /100 | #187 | Fair 92.4% |
| Immigrants | Indonesia | 33.7 /100 | #188 | Fair 92.4% |
| Immigrants | Chile | 33.3 /100 | #189 | Fair 92.4% |
| Chickasaw | 31.4 /100 | #190 | Fair 92.3% |
| French American Indians | 30.8 /100 | #191 | Fair 92.3% |
| Immigrants | Syria | 30.4 /100 | #192 | Fair 92.3% |
| Moroccans | 28.7 /100 | #193 | Fair 92.3% |
Demographics Similar to French Canadians by 11th Grade
In terms of 11th grade, the demographic groups most similar to French Canadians are New Zealander (94.0%, a difference of 0.0%), Iranian (94.0%, a difference of 0.0%), Bhutanese (94.0%, a difference of 0.0%), Okinawan (94.0%, a difference of 0.0%), and Immigrants from North America (94.0%, a difference of 0.010%).
| Demographics | Rating | Rank | 11th Grade |
| Slavs | 99.9 /100 | #49 | Exceptional 94.1% |
| French | 99.9 /100 | #50 | Exceptional 94.1% |
| Turks | 99.9 /100 | #51 | Exceptional 94.0% |
| Immigrants | Canada | 99.9 /100 | #52 | Exceptional 94.0% |
| Immigrants | Australia | 99.9 /100 | #53 | Exceptional 94.0% |
| Immigrants | North America | 99.9 /100 | #54 | Exceptional 94.0% |
| Czechoslovakians | 99.9 /100 | #55 | Exceptional 94.0% |
| French Canadians | 99.9 /100 | #56 | Exceptional 94.0% |
| New Zealanders | 99.9 /100 | #57 | Exceptional 94.0% |
| Iranians | 99.9 /100 | #58 | Exceptional 94.0% |
| Bhutanese | 99.8 /100 | #59 | Exceptional 94.0% |
| Okinawans | 99.8 /100 | #60 | Exceptional 94.0% |
| Immigrants | Belgium | 99.8 /100 | #61 | Exceptional 94.0% |
| Austrians | 99.8 /100 | #62 | Exceptional 94.0% |
| Ukrainians | 99.8 /100 | #63 | Exceptional 94.0% |