Arab vs Sioux 11th Grade
COMPARE
Arab
Sioux
11th Grade
11th Grade Comparison
Arabs
Sioux
92.9%
11TH GRADE
85.4/ 100
METRIC RATING
137th/ 347
METRIC RANK
92.3%
11TH GRADE
28.5/ 100
METRIC RATING
194th/ 347
METRIC RANK
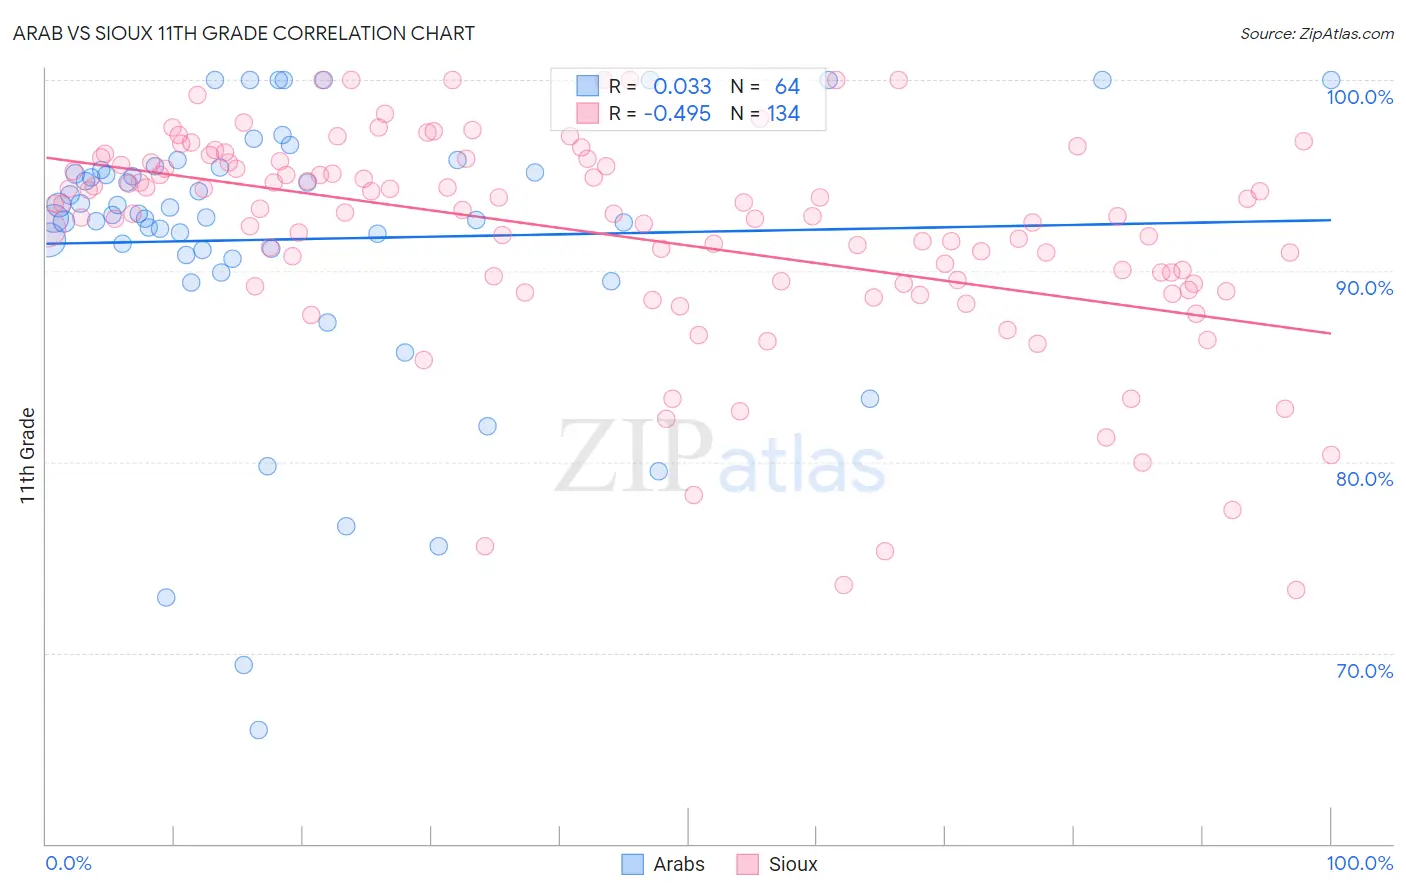
Arab vs Sioux 11th Grade Correlation Chart
The statistical analysis conducted on geographies consisting of 486,870,847 people shows no correlation between the proportion of Arabs and percentage of population with at least 11th grade education in the United States with a correlation coefficient (R) of 0.033 and weighted average of 92.9%. Similarly, the statistical analysis conducted on geographies consisting of 234,198,917 people shows a moderate negative correlation between the proportion of Sioux and percentage of population with at least 11th grade education in the United States with a correlation coefficient (R) of -0.495 and weighted average of 92.3%, a difference of 0.66%.
11th Grade Correlation Summary
| Measurement | Arab | Sioux |
| Minimum | 66.0% | 73.3% |
| Maximum | 100.0% | 100.0% |
| Range | 34.0% | 26.7% |
| Mean | 91.7% | 91.9% |
| Median | 93.0% | 93.0% |
| Interquartile 25% (IQ1) | 91.0% | 89.4% |
| Interquartile 75% (IQ3) | 95.3% | 95.7% |
| Interquartile Range (IQR) | 4.4% | 6.3% |
| Standard Deviation (Sample) | 7.4% | 5.6% |
| Standard Deviation (Population) | 7.3% | 5.6% |
Similar Demographics by 11th Grade
Demographics Similar to Arabs by 11th Grade
In terms of 11th grade, the demographic groups most similar to Arabs are Cree (92.9%, a difference of 0.010%), Immigrants from Brazil (92.9%, a difference of 0.010%), Immigrants from Italy (92.9%, a difference of 0.020%), Crow (92.9%, a difference of 0.030%), and Mongolian (93.0%, a difference of 0.040%).
| Demographics | Rating | Rank | 11th Grade |
| Albanians | 89.5 /100 | #130 | Excellent 93.0% |
| Egyptians | 89.5 /100 | #131 | Excellent 93.0% |
| Immigrants | Bosnia and Herzegovina | 89.0 /100 | #132 | Excellent 93.0% |
| Mongolians | 87.6 /100 | #133 | Excellent 93.0% |
| Delaware | 87.3 /100 | #134 | Excellent 93.0% |
| Immigrants | Italy | 86.6 /100 | #135 | Excellent 92.9% |
| Cree | 85.9 /100 | #136 | Excellent 92.9% |
| Arabs | 85.4 /100 | #137 | Excellent 92.9% |
| Immigrants | Brazil | 85.1 /100 | #138 | Excellent 92.9% |
| Crow | 84.1 /100 | #139 | Excellent 92.9% |
| Venezuelans | 83.4 /100 | #140 | Excellent 92.9% |
| Chileans | 83.0 /100 | #141 | Excellent 92.9% |
| Kenyans | 82.0 /100 | #142 | Excellent 92.9% |
| Ugandans | 81.4 /100 | #143 | Excellent 92.9% |
| Assyrians/Chaldeans/Syriacs | 80.5 /100 | #144 | Excellent 92.8% |
Demographics Similar to Sioux by 11th Grade
In terms of 11th grade, the demographic groups most similar to Sioux are Moroccan (92.3%, a difference of 0.0%), Immigrants from Syria (92.3%, a difference of 0.020%), Liberian (92.3%, a difference of 0.020%), Chickasaw (92.3%, a difference of 0.030%), and French American Indian (92.3%, a difference of 0.030%).
| Demographics | Rating | Rank | 11th Grade |
| Immigrants | Western Asia | 35.0 /100 | #187 | Fair 92.4% |
| Immigrants | Indonesia | 33.7 /100 | #188 | Fair 92.4% |
| Immigrants | Chile | 33.3 /100 | #189 | Fair 92.4% |
| Chickasaw | 31.4 /100 | #190 | Fair 92.3% |
| French American Indians | 30.8 /100 | #191 | Fair 92.3% |
| Immigrants | Syria | 30.4 /100 | #192 | Fair 92.3% |
| Moroccans | 28.7 /100 | #193 | Fair 92.3% |
| Sioux | 28.5 /100 | #194 | Fair 92.3% |
| Liberians | 26.8 /100 | #195 | Fair 92.3% |
| Panamanians | 26.4 /100 | #196 | Fair 92.3% |
| Marshallese | 26.0 /100 | #197 | Fair 92.3% |
| Hawaiians | 25.5 /100 | #198 | Fair 92.3% |
| Immigrants | Uganda | 25.2 /100 | #199 | Fair 92.3% |
| Samoans | 25.1 /100 | #200 | Fair 92.3% |
| Immigrants | China | 25.1 /100 | #201 | Fair 92.3% |