Arab vs Immigrants from Latvia College, Under 1 year
COMPARE
Arab
Immigrants from Latvia
College, Under 1 year
College, Under 1 year Comparison
Arabs
Immigrants from Latvia
67.2%
COLLEGE, UNDER 1 YEAR
92.6/ 100
METRIC RATING
124th/ 347
METRIC RANK
70.1%
COLLEGE, UNDER 1 YEAR
99.9/ 100
METRIC RATING
46th/ 347
METRIC RANK
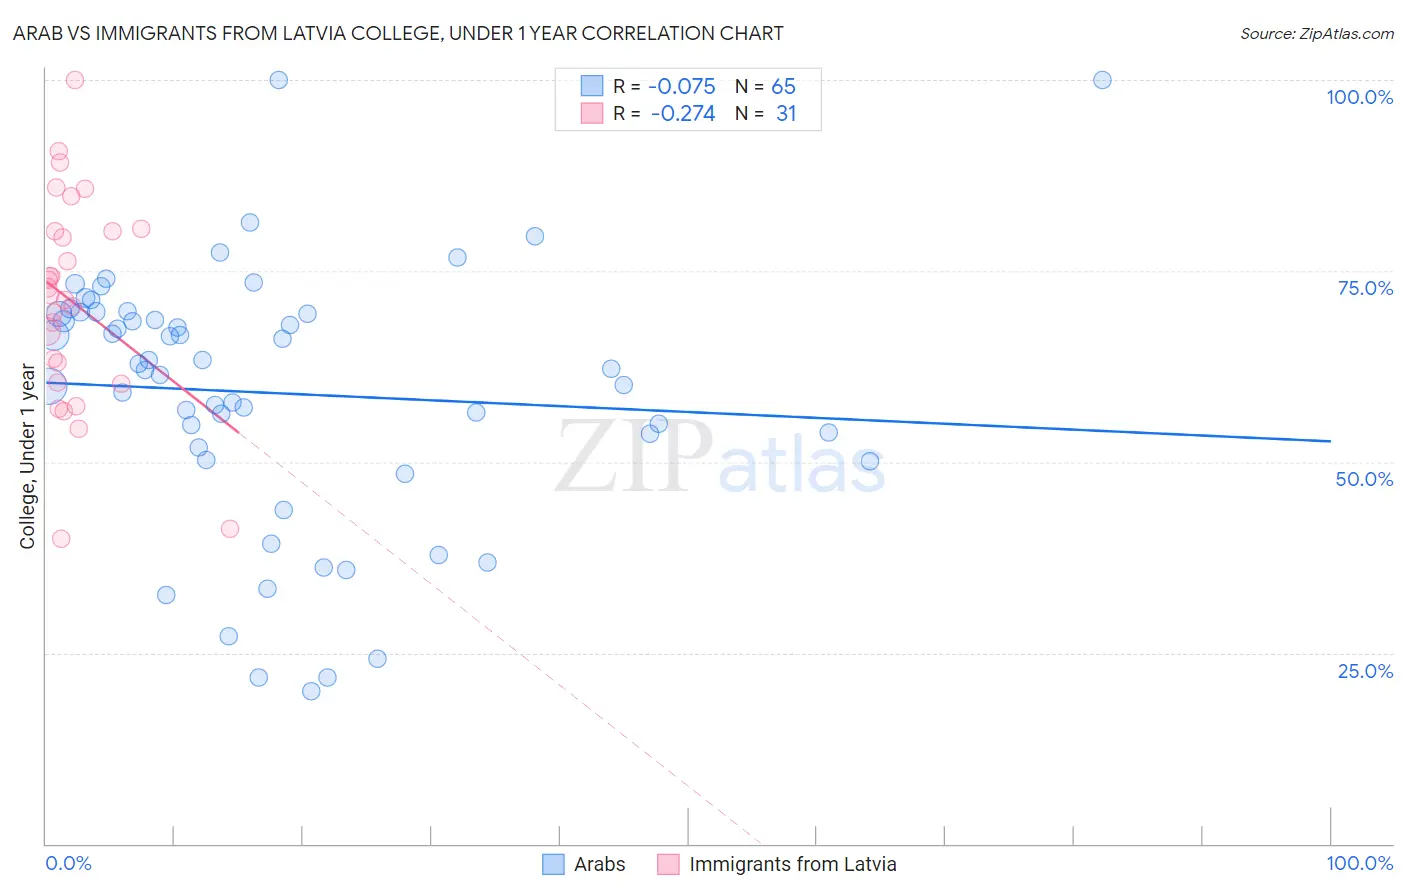
Arab vs Immigrants from Latvia College, Under 1 year Correlation Chart
The statistical analysis conducted on geographies consisting of 486,870,114 people shows a slight negative correlation between the proportion of Arabs and percentage of population with at least college, under 1 year education in the United States with a correlation coefficient (R) of -0.075 and weighted average of 67.2%. Similarly, the statistical analysis conducted on geographies consisting of 113,735,345 people shows a weak negative correlation between the proportion of Immigrants from Latvia and percentage of population with at least college, under 1 year education in the United States with a correlation coefficient (R) of -0.274 and weighted average of 70.1%, a difference of 4.3%.
College, Under 1 year Correlation Summary
| Measurement | Arab | Immigrants from Latvia |
| Minimum | 20.0% | 40.0% |
| Maximum | 100.0% | 100.0% |
| Range | 80.0% | 60.0% |
| Mean | 59.0% | 71.0% |
| Median | 62.3% | 71.9% |
| Interquartile 25% (IQ1) | 51.1% | 60.4% |
| Interquartile 75% (IQ3) | 69.5% | 80.2% |
| Interquartile Range (IQR) | 18.5% | 19.8% |
| Standard Deviation (Sample) | 17.0% | 13.7% |
| Standard Deviation (Population) | 16.9% | 13.5% |
Similar Demographics by College, Under 1 year
Demographics Similar to Arabs by College, Under 1 year
In terms of college, under 1 year, the demographic groups most similar to Arabs are Immigrants from Northern Africa (67.2%, a difference of 0.010%), Immigrants from Jordan (67.3%, a difference of 0.030%), Slovene (67.3%, a difference of 0.12%), Italian (67.2%, a difference of 0.12%), and Alsatian (67.1%, a difference of 0.18%).
| Demographics | Rating | Rank | College, Under 1 year |
| Pakistanis | 94.8 /100 | #117 | Exceptional 67.5% |
| Immigrants | Ukraine | 94.7 /100 | #118 | Exceptional 67.5% |
| Lebanese | 94.6 /100 | #119 | Exceptional 67.5% |
| Serbians | 93.9 /100 | #120 | Exceptional 67.4% |
| Slovenes | 93.3 /100 | #121 | Exceptional 67.3% |
| Immigrants | Jordan | 92.8 /100 | #122 | Exceptional 67.3% |
| Immigrants | Northern Africa | 92.7 /100 | #123 | Exceptional 67.2% |
| Arabs | 92.6 /100 | #124 | Exceptional 67.2% |
| Italians | 91.8 /100 | #125 | Exceptional 67.2% |
| Alsatians | 91.3 /100 | #126 | Exceptional 67.1% |
| Czechs | 90.8 /100 | #127 | Exceptional 67.1% |
| Scottish | 90.2 /100 | #128 | Exceptional 67.0% |
| Immigrants | Eastern Africa | 89.5 /100 | #129 | Excellent 67.0% |
| Immigrants | Syria | 89.0 /100 | #130 | Excellent 66.9% |
| Finns | 88.6 /100 | #131 | Excellent 66.9% |
Demographics Similar to Immigrants from Latvia by College, Under 1 year
In terms of college, under 1 year, the demographic groups most similar to Immigrants from Latvia are Immigrants from Bulgaria (70.0%, a difference of 0.11%), Immigrants from Norway (70.2%, a difference of 0.12%), Israeli (70.2%, a difference of 0.14%), New Zealander (70.2%, a difference of 0.14%), and Immigrants from Netherlands (70.0%, a difference of 0.17%).
| Demographics | Rating | Rank | College, Under 1 year |
| Bhutanese | 99.9 /100 | #39 | Exceptional 70.3% |
| Immigrants | Turkey | 99.9 /100 | #40 | Exceptional 70.3% |
| Immigrants | Kuwait | 99.9 /100 | #41 | Exceptional 70.3% |
| Immigrants | Lithuania | 99.9 /100 | #42 | Exceptional 70.3% |
| Israelis | 99.9 /100 | #43 | Exceptional 70.2% |
| New Zealanders | 99.9 /100 | #44 | Exceptional 70.2% |
| Immigrants | Norway | 99.9 /100 | #45 | Exceptional 70.2% |
| Immigrants | Latvia | 99.9 /100 | #46 | Exceptional 70.1% |
| Immigrants | Bulgaria | 99.8 /100 | #47 | Exceptional 70.0% |
| Immigrants | Netherlands | 99.8 /100 | #48 | Exceptional 70.0% |
| Immigrants | Austria | 99.8 /100 | #49 | Exceptional 70.0% |
| Zimbabweans | 99.8 /100 | #50 | Exceptional 69.9% |
| Mongolians | 99.8 /100 | #51 | Exceptional 69.9% |
| Immigrants | Russia | 99.8 /100 | #52 | Exceptional 69.9% |
| South Africans | 99.7 /100 | #53 | Exceptional 69.7% |