Immigrants from Chile vs Immigrants from Latvia College, Under 1 year
COMPARE
Immigrants from Chile
Immigrants from Latvia
College, Under 1 year
College, Under 1 year Comparison
Immigrants from Chile
Immigrants from Latvia
66.8%
COLLEGE, UNDER 1 YEAR
87.4/ 100
METRIC RATING
137th/ 347
METRIC RANK
70.1%
COLLEGE, UNDER 1 YEAR
99.9/ 100
METRIC RATING
46th/ 347
METRIC RANK
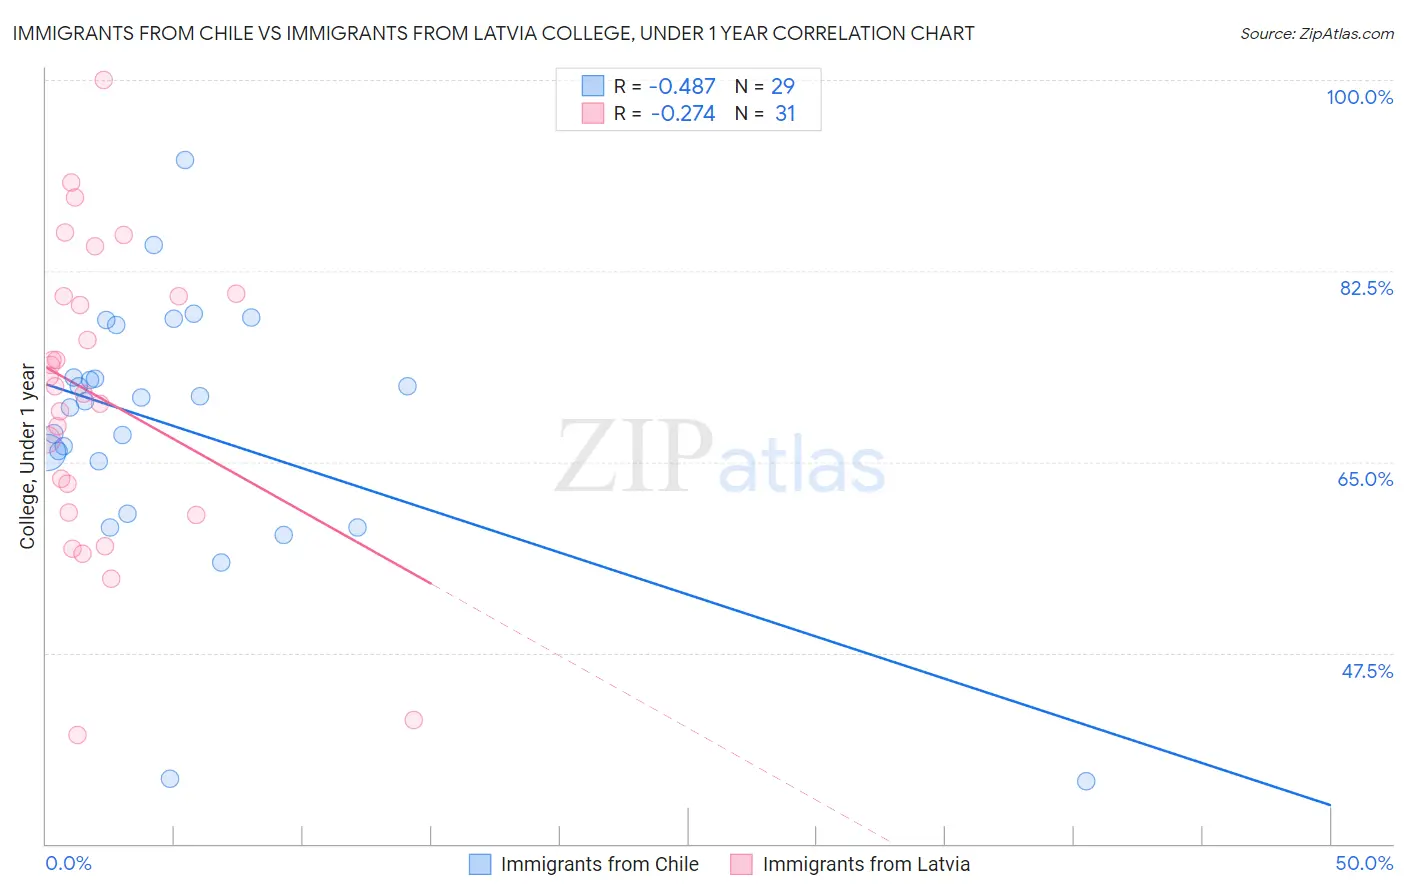
Immigrants from Chile vs Immigrants from Latvia College, Under 1 year Correlation Chart
The statistical analysis conducted on geographies consisting of 218,647,266 people shows a moderate negative correlation between the proportion of Immigrants from Chile and percentage of population with at least college, under 1 year education in the United States with a correlation coefficient (R) of -0.487 and weighted average of 66.8%. Similarly, the statistical analysis conducted on geographies consisting of 113,735,345 people shows a weak negative correlation between the proportion of Immigrants from Latvia and percentage of population with at least college, under 1 year education in the United States with a correlation coefficient (R) of -0.274 and weighted average of 70.1%, a difference of 5.0%.
College, Under 1 year Correlation Summary
| Measurement | Immigrants from Chile | Immigrants from Latvia |
| Minimum | 35.7% | 40.0% |
| Maximum | 92.6% | 100.0% |
| Range | 56.9% | 60.0% |
| Mean | 68.1% | 71.0% |
| Median | 70.6% | 71.9% |
| Interquartile 25% (IQ1) | 62.6% | 60.4% |
| Interquartile 75% (IQ3) | 75.1% | 80.2% |
| Interquartile Range (IQR) | 12.5% | 19.8% |
| Standard Deviation (Sample) | 12.1% | 13.7% |
| Standard Deviation (Population) | 11.9% | 13.5% |
Similar Demographics by College, Under 1 year
Demographics Similar to Immigrants from Chile by College, Under 1 year
In terms of college, under 1 year, the demographic groups most similar to Immigrants from Chile are Ugandan (66.8%, a difference of 0.040%), Canadian (66.8%, a difference of 0.050%), Immigrants from Italy (66.8%, a difference of 0.050%), Iraqi (66.8%, a difference of 0.060%), and Immigrants from Brazil (66.9%, a difference of 0.090%).
| Demographics | Rating | Rank | College, Under 1 year |
| Immigrants | Syria | 89.0 /100 | #130 | Excellent 66.9% |
| Finns | 88.6 /100 | #131 | Excellent 66.9% |
| Poles | 88.4 /100 | #132 | Excellent 66.9% |
| Immigrants | Brazil | 88.3 /100 | #133 | Excellent 66.9% |
| Iraqis | 88.0 /100 | #134 | Excellent 66.8% |
| Canadians | 87.9 /100 | #135 | Excellent 66.8% |
| Ugandans | 87.8 /100 | #136 | Excellent 66.8% |
| Immigrants | Chile | 87.4 /100 | #137 | Excellent 66.8% |
| Immigrants | Italy | 86.9 /100 | #138 | Excellent 66.8% |
| Venezuelans | 85.9 /100 | #139 | Excellent 66.7% |
| Slavs | 85.9 /100 | #140 | Excellent 66.7% |
| Immigrants | Afghanistan | 85.1 /100 | #141 | Excellent 66.7% |
| English | 82.9 /100 | #142 | Excellent 66.6% |
| Immigrants | Uganda | 82.8 /100 | #143 | Excellent 66.5% |
| Immigrants | Germany | 82.0 /100 | #144 | Excellent 66.5% |
Demographics Similar to Immigrants from Latvia by College, Under 1 year
In terms of college, under 1 year, the demographic groups most similar to Immigrants from Latvia are Immigrants from Bulgaria (70.0%, a difference of 0.11%), Immigrants from Norway (70.2%, a difference of 0.12%), Israeli (70.2%, a difference of 0.14%), New Zealander (70.2%, a difference of 0.14%), and Immigrants from Netherlands (70.0%, a difference of 0.17%).
| Demographics | Rating | Rank | College, Under 1 year |
| Bhutanese | 99.9 /100 | #39 | Exceptional 70.3% |
| Immigrants | Turkey | 99.9 /100 | #40 | Exceptional 70.3% |
| Immigrants | Kuwait | 99.9 /100 | #41 | Exceptional 70.3% |
| Immigrants | Lithuania | 99.9 /100 | #42 | Exceptional 70.3% |
| Israelis | 99.9 /100 | #43 | Exceptional 70.2% |
| New Zealanders | 99.9 /100 | #44 | Exceptional 70.2% |
| Immigrants | Norway | 99.9 /100 | #45 | Exceptional 70.2% |
| Immigrants | Latvia | 99.9 /100 | #46 | Exceptional 70.1% |
| Immigrants | Bulgaria | 99.8 /100 | #47 | Exceptional 70.0% |
| Immigrants | Netherlands | 99.8 /100 | #48 | Exceptional 70.0% |
| Immigrants | Austria | 99.8 /100 | #49 | Exceptional 70.0% |
| Zimbabweans | 99.8 /100 | #50 | Exceptional 69.9% |
| Mongolians | 99.8 /100 | #51 | Exceptional 69.9% |
| Immigrants | Russia | 99.8 /100 | #52 | Exceptional 69.9% |
| South Africans | 99.7 /100 | #53 | Exceptional 69.7% |