Arab vs Immigrants from Asia 2nd Grade
COMPARE
Arab
Immigrants from Asia
2nd Grade
2nd Grade Comparison
Arabs
Immigrants from Asia
97.8%
2ND GRADE
36.9/ 100
METRIC RATING
186th/ 347
METRIC RANK
97.5%
2ND GRADE
0.7/ 100
METRIC RATING
252nd/ 347
METRIC RANK
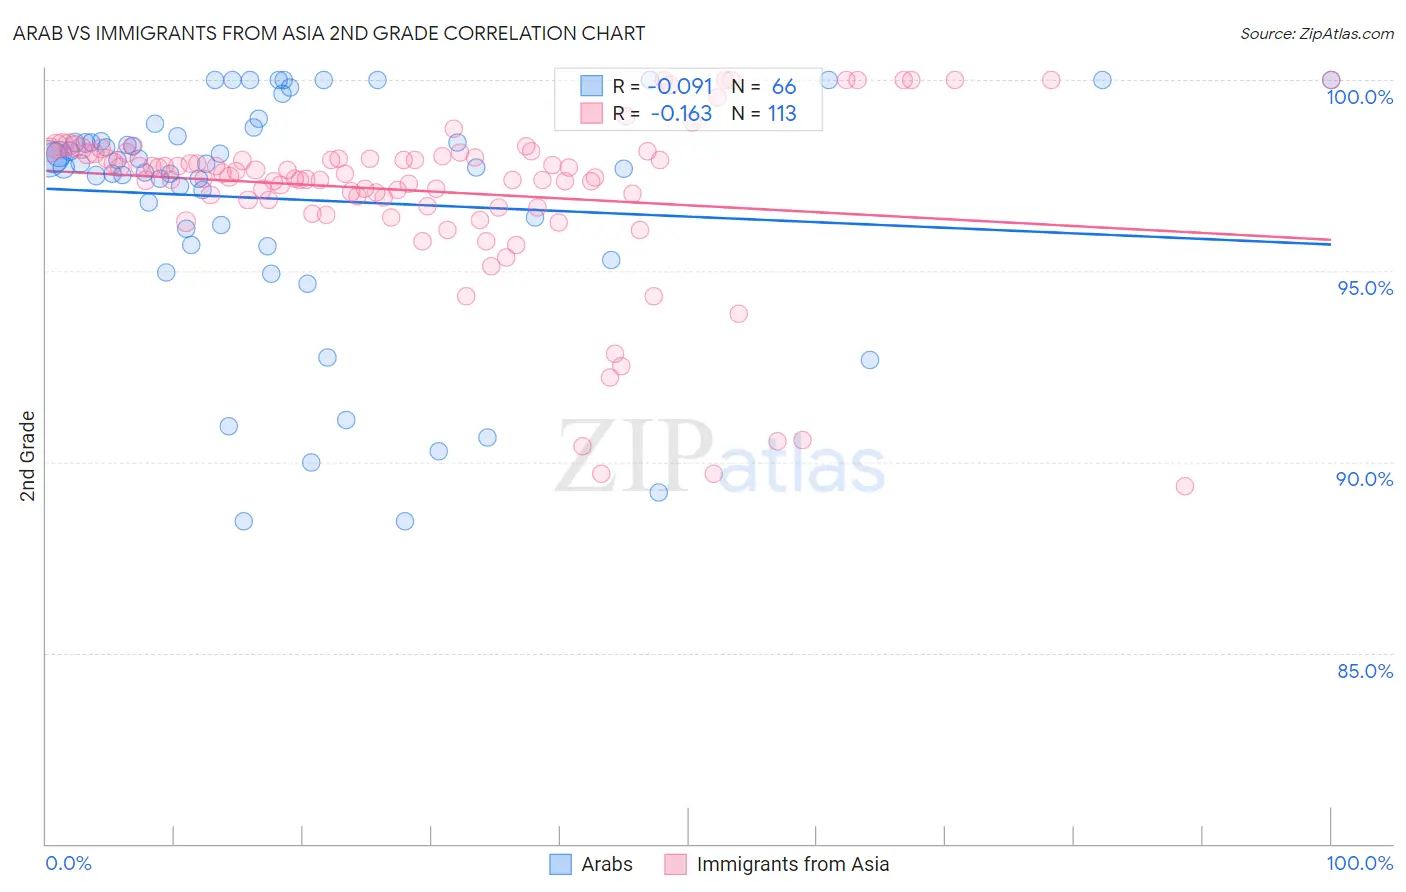
Arab vs Immigrants from Asia 2nd Grade Correlation Chart
The statistical analysis conducted on geographies consisting of 486,872,222 people shows a slight negative correlation between the proportion of Arabs and percentage of population with at least 2nd grade education in the United States with a correlation coefficient (R) of -0.091 and weighted average of 97.8%. Similarly, the statistical analysis conducted on geographies consisting of 549,170,546 people shows a poor negative correlation between the proportion of Immigrants from Asia and percentage of population with at least 2nd grade education in the United States with a correlation coefficient (R) of -0.163 and weighted average of 97.5%, a difference of 0.35%.
2nd Grade Correlation Summary
| Measurement | Arab | Immigrants from Asia |
| Minimum | 88.4% | 89.4% |
| Maximum | 100.0% | 100.0% |
| Range | 11.6% | 10.6% |
| Mean | 96.9% | 97.1% |
| Median | 97.8% | 97.5% |
| Interquartile 25% (IQ1) | 96.1% | 96.8% |
| Interquartile 75% (IQ3) | 98.5% | 98.1% |
| Interquartile Range (IQR) | 2.4% | 1.3% |
| Standard Deviation (Sample) | 3.1% | 2.2% |
| Standard Deviation (Population) | 3.1% | 2.2% |
Similar Demographics by 2nd Grade
Demographics Similar to Arabs by 2nd Grade
In terms of 2nd grade, the demographic groups most similar to Arabs are Pakistani (97.8%, a difference of 0.0%), Immigrants from Kazakhstan (97.8%, a difference of 0.0%), Immigrants from Argentina (97.8%, a difference of 0.010%), Panamanian (97.8%, a difference of 0.010%), and Native/Alaskan (97.9%, a difference of 0.020%).
| Demographics | Rating | Rank | 2nd Grade |
| Immigrants | Venezuela | 46.1 /100 | #179 | Average 97.9% |
| Natives/Alaskans | 44.3 /100 | #180 | Average 97.9% |
| Egyptians | 44.3 /100 | #181 | Average 97.9% |
| Portuguese | 42.4 /100 | #182 | Average 97.8% |
| Immigrants | Poland | 42.2 /100 | #183 | Average 97.8% |
| Immigrants | Belarus | 41.5 /100 | #184 | Average 97.8% |
| Immigrants | Argentina | 40.6 /100 | #185 | Average 97.8% |
| Arabs | 36.9 /100 | #186 | Fair 97.8% |
| Pakistanis | 36.1 /100 | #187 | Fair 97.8% |
| Immigrants | Kazakhstan | 35.6 /100 | #188 | Fair 97.8% |
| Panamanians | 33.5 /100 | #189 | Fair 97.8% |
| Immigrants | Taiwan | 31.8 /100 | #190 | Fair 97.8% |
| Paraguayans | 30.8 /100 | #191 | Fair 97.8% |
| Blacks/African Americans | 29.9 /100 | #192 | Fair 97.8% |
| Hawaiians | 28.5 /100 | #193 | Fair 97.8% |
Demographics Similar to Immigrants from Asia by 2nd Grade
In terms of 2nd grade, the demographic groups most similar to Immigrants from Asia are Puerto Rican (97.5%, a difference of 0.0%), Peruvian (97.5%, a difference of 0.010%), Immigrants from Africa (97.5%, a difference of 0.010%), Indian (Asian) (97.5%, a difference of 0.010%), and Immigrants from Eastern Africa (97.5%, a difference of 0.020%).
| Demographics | Rating | Rank | 2nd Grade |
| Immigrants | Eastern Africa | 0.9 /100 | #245 | Tragic 97.5% |
| South Americans | 0.9 /100 | #246 | Tragic 97.5% |
| Immigrants | Senegal | 0.9 /100 | #247 | Tragic 97.5% |
| Immigrants | Middle Africa | 0.9 /100 | #248 | Tragic 97.5% |
| Bolivians | 0.9 /100 | #249 | Tragic 97.5% |
| Peruvians | 0.9 /100 | #250 | Tragic 97.5% |
| Immigrants | Africa | 0.8 /100 | #251 | Tragic 97.5% |
| Immigrants | Asia | 0.7 /100 | #252 | Tragic 97.5% |
| Puerto Ricans | 0.7 /100 | #253 | Tragic 97.5% |
| Indians (Asian) | 0.6 /100 | #254 | Tragic 97.5% |
| Immigrants | Congo | 0.6 /100 | #255 | Tragic 97.5% |
| Jamaicans | 0.6 /100 | #256 | Tragic 97.5% |
| Immigrants | Colombia | 0.5 /100 | #257 | Tragic 97.5% |
| Yaqui | 0.5 /100 | #258 | Tragic 97.5% |
| Fijians | 0.5 /100 | #259 | Tragic 97.5% |