Nigerian vs Dominican 5th Grade
COMPARE
Nigerian
Dominican
5th Grade
5th Grade Comparison
Nigerians
Dominicans
96.9%
5TH GRADE
1.9/ 100
METRIC RATING
239th/ 347
METRIC RANK
95.5%
5TH GRADE
0.0/ 100
METRIC RATING
327th/ 347
METRIC RANK
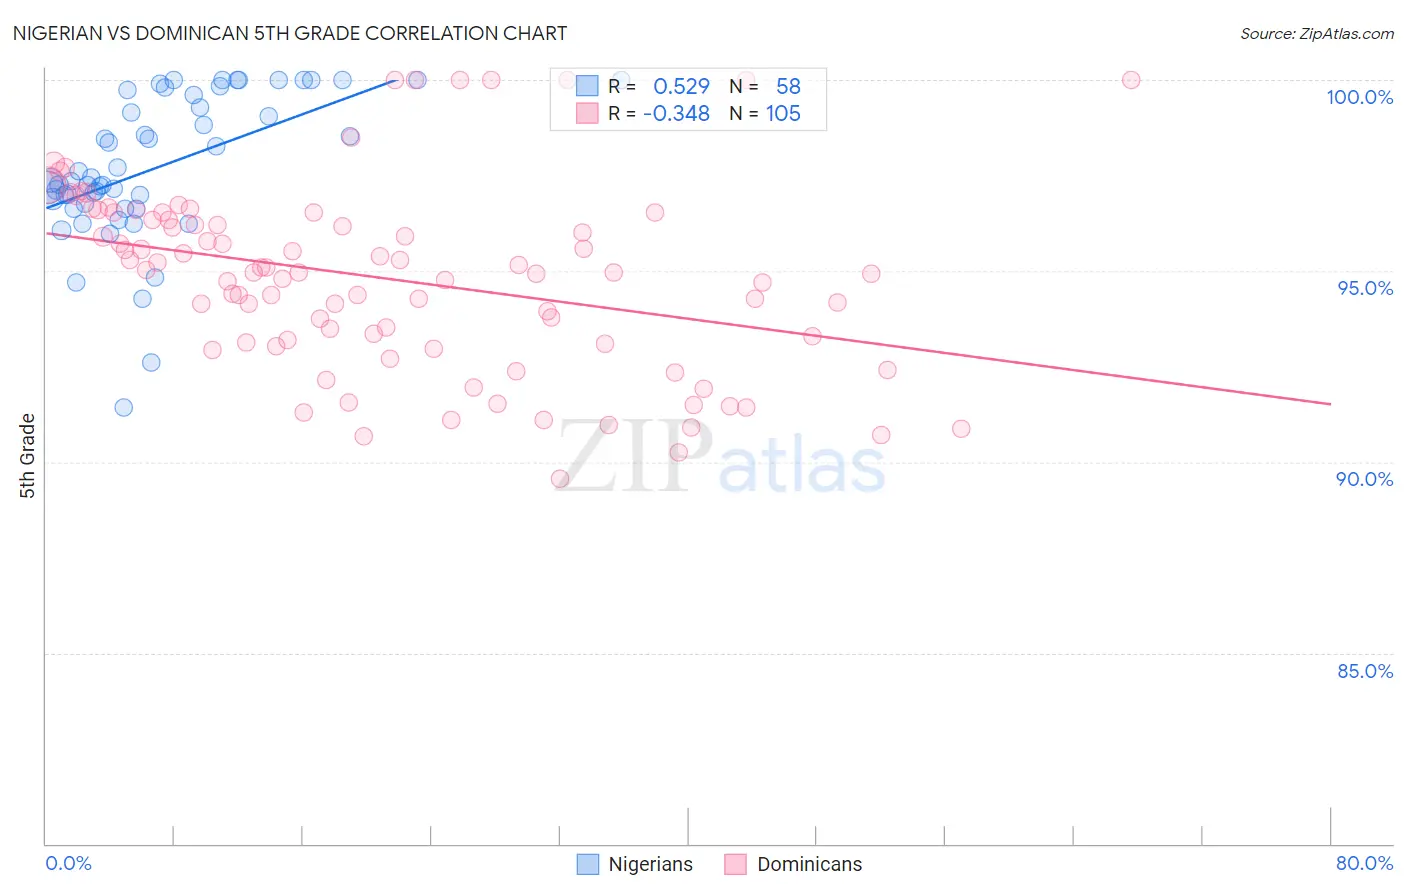
Nigerian vs Dominican 5th Grade Correlation Chart
The statistical analysis conducted on geographies consisting of 332,724,627 people shows a substantial positive correlation between the proportion of Nigerians and percentage of population with at least 5th grade education in the United States with a correlation coefficient (R) of 0.529 and weighted average of 96.9%. Similarly, the statistical analysis conducted on geographies consisting of 355,142,603 people shows a mild negative correlation between the proportion of Dominicans and percentage of population with at least 5th grade education in the United States with a correlation coefficient (R) of -0.348 and weighted average of 95.5%, a difference of 1.5%.
5th Grade Correlation Summary
| Measurement | Nigerian | Dominican |
| Minimum | 91.4% | 89.6% |
| Maximum | 100.0% | 100.0% |
| Range | 8.6% | 10.4% |
| Mean | 97.7% | 94.8% |
| Median | 97.4% | 95.0% |
| Interquartile 25% (IQ1) | 96.8% | 93.1% |
| Interquartile 75% (IQ3) | 99.6% | 96.4% |
| Interquartile Range (IQR) | 2.8% | 3.3% |
| Standard Deviation (Sample) | 1.9% | 2.4% |
| Standard Deviation (Population) | 1.9% | 2.4% |
Similar Demographics by 5th Grade
Demographics Similar to Nigerians by 5th Grade
In terms of 5th grade, the demographic groups most similar to Nigerians are Asian (96.9%, a difference of 0.0%), Indian (Asian) (96.9%, a difference of 0.0%), Immigrants from Indonesia (96.9%, a difference of 0.010%), Immigrants from Asia (96.9%, a difference of 0.020%), and Immigrants from Costa Rica (96.9%, a difference of 0.020%).
| Demographics | Rating | Rank | 5th Grade |
| Immigrants | Eastern Asia | 4.0 /100 | #232 | Tragic 97.0% |
| Sub-Saharan Africans | 3.3 /100 | #233 | Tragic 97.0% |
| Tohono O'odham | 3.2 /100 | #234 | Tragic 97.0% |
| Uruguayans | 3.2 /100 | #235 | Tragic 97.0% |
| Senegalese | 2.8 /100 | #236 | Tragic 97.0% |
| Immigrants | Indonesia | 2.0 /100 | #237 | Tragic 96.9% |
| Asians | 2.0 /100 | #238 | Tragic 96.9% |
| Nigerians | 1.9 /100 | #239 | Tragic 96.9% |
| Indians (Asian) | 1.9 /100 | #240 | Tragic 96.9% |
| Immigrants | Asia | 1.7 /100 | #241 | Tragic 96.9% |
| Immigrants | Costa Rica | 1.6 /100 | #242 | Tragic 96.9% |
| Immigrants | Eastern Africa | 1.6 /100 | #243 | Tragic 96.9% |
| Koreans | 1.6 /100 | #244 | Tragic 96.9% |
| Colombians | 1.3 /100 | #245 | Tragic 96.9% |
| Ethiopians | 1.2 /100 | #246 | Tragic 96.9% |
Demographics Similar to Dominicans by 5th Grade
In terms of 5th grade, the demographic groups most similar to Dominicans are Immigrants from Cambodia (95.5%, a difference of 0.0%), Honduran (95.6%, a difference of 0.030%), Hispanic or Latino (95.6%, a difference of 0.030%), Cape Verdean (95.5%, a difference of 0.030%), and Mexican American Indian (95.5%, a difference of 0.040%).
| Demographics | Rating | Rank | 5th Grade |
| Central American Indians | 0.0 /100 | #320 | Tragic 95.7% |
| Immigrants | Belize | 0.0 /100 | #321 | Tragic 95.7% |
| Immigrants | Nicaragua | 0.0 /100 | #322 | Tragic 95.6% |
| Immigrants | Fiji | 0.0 /100 | #323 | Tragic 95.6% |
| Hondurans | 0.0 /100 | #324 | Tragic 95.6% |
| Hispanics or Latinos | 0.0 /100 | #325 | Tragic 95.6% |
| Immigrants | Cambodia | 0.0 /100 | #326 | Tragic 95.5% |
| Dominicans | 0.0 /100 | #327 | Tragic 95.5% |
| Cape Verdeans | 0.0 /100 | #328 | Tragic 95.5% |
| Mexican American Indians | 0.0 /100 | #329 | Tragic 95.5% |
| Immigrants | Armenia | 0.0 /100 | #330 | Tragic 95.4% |
| Immigrants | Honduras | 0.0 /100 | #331 | Tragic 95.4% |
| Immigrants | Dominican Republic | 0.0 /100 | #332 | Tragic 95.3% |
| Immigrants | Latin America | 0.0 /100 | #333 | Tragic 95.3% |
| Nepalese | 0.0 /100 | #334 | Tragic 95.2% |