Cree vs Dominican 5th Grade
COMPARE
Cree
Dominican
5th Grade
5th Grade Comparison
Cree
Dominicans
97.7%
5TH GRADE
98.4/ 100
METRIC RATING
97th/ 347
METRIC RANK
95.5%
5TH GRADE
0.0/ 100
METRIC RATING
327th/ 347
METRIC RANK
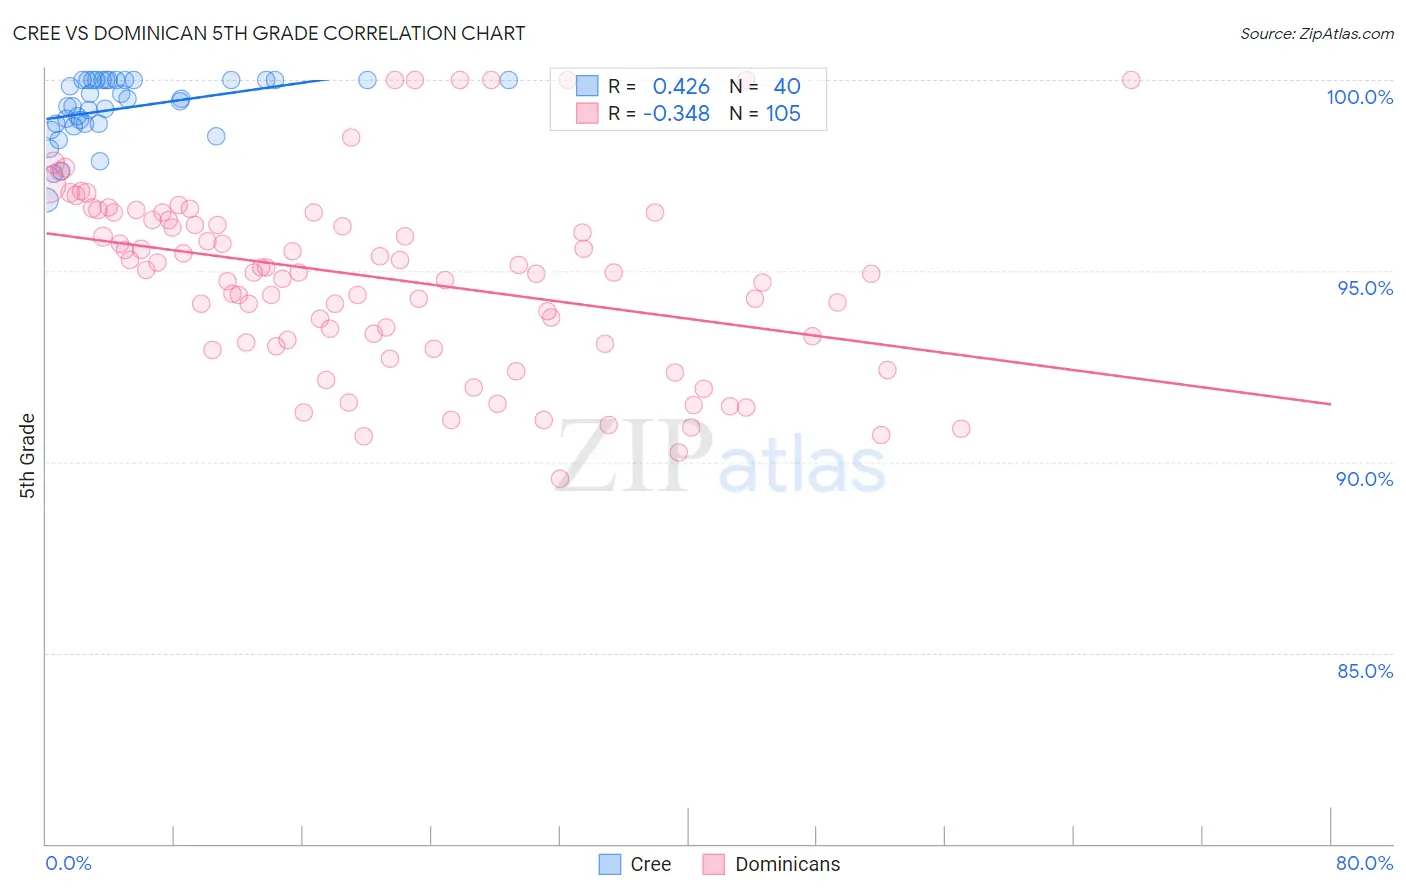
Cree vs Dominican 5th Grade Correlation Chart
The statistical analysis conducted on geographies consisting of 76,204,399 people shows a moderate positive correlation between the proportion of Cree and percentage of population with at least 5th grade education in the United States with a correlation coefficient (R) of 0.426 and weighted average of 97.7%. Similarly, the statistical analysis conducted on geographies consisting of 355,142,603 people shows a mild negative correlation between the proportion of Dominicans and percentage of population with at least 5th grade education in the United States with a correlation coefficient (R) of -0.348 and weighted average of 95.5%, a difference of 2.3%.
5th Grade Correlation Summary
| Measurement | Cree | Dominican |
| Minimum | 96.9% | 89.6% |
| Maximum | 100.0% | 100.0% |
| Range | 3.1% | 10.4% |
| Mean | 99.3% | 94.8% |
| Median | 99.5% | 95.0% |
| Interquartile 25% (IQ1) | 98.9% | 93.1% |
| Interquartile 75% (IQ3) | 100.0% | 96.4% |
| Interquartile Range (IQR) | 1.1% | 3.3% |
| Standard Deviation (Sample) | 0.81% | 2.4% |
| Standard Deviation (Population) | 0.80% | 2.4% |
Similar Demographics by 5th Grade
Demographics Similar to Cree by 5th Grade
In terms of 5th grade, the demographic groups most similar to Cree are Immigrants from Denmark (97.8%, a difference of 0.010%), Romanian (97.8%, a difference of 0.010%), Immigrants from Germany (97.8%, a difference of 0.010%), Yugoslavian (97.7%, a difference of 0.010%), and Turkish (97.7%, a difference of 0.010%).
| Demographics | Rating | Rank | 5th Grade |
| Immigrants | Ireland | 98.8 /100 | #90 | Exceptional 97.8% |
| Immigrants | Western Europe | 98.8 /100 | #91 | Exceptional 97.8% |
| Immigrants | Sweden | 98.7 /100 | #92 | Exceptional 97.8% |
| Delaware | 98.6 /100 | #93 | Exceptional 97.8% |
| Immigrants | Denmark | 98.6 /100 | #94 | Exceptional 97.8% |
| Romanians | 98.6 /100 | #95 | Exceptional 97.8% |
| Immigrants | Germany | 98.5 /100 | #96 | Exceptional 97.8% |
| Cree | 98.4 /100 | #97 | Exceptional 97.7% |
| Yugoslavians | 98.3 /100 | #98 | Exceptional 97.7% |
| Turks | 98.3 /100 | #99 | Exceptional 97.7% |
| Puget Sound Salish | 98.3 /100 | #100 | Exceptional 97.7% |
| South Africans | 98.3 /100 | #101 | Exceptional 97.7% |
| Choctaw | 98.0 /100 | #102 | Exceptional 97.7% |
| Cheyenne | 97.9 /100 | #103 | Exceptional 97.7% |
| German Russians | 97.8 /100 | #104 | Exceptional 97.7% |
Demographics Similar to Dominicans by 5th Grade
In terms of 5th grade, the demographic groups most similar to Dominicans are Immigrants from Cambodia (95.5%, a difference of 0.0%), Honduran (95.6%, a difference of 0.030%), Hispanic or Latino (95.6%, a difference of 0.030%), Cape Verdean (95.5%, a difference of 0.030%), and Mexican American Indian (95.5%, a difference of 0.040%).
| Demographics | Rating | Rank | 5th Grade |
| Central American Indians | 0.0 /100 | #320 | Tragic 95.7% |
| Immigrants | Belize | 0.0 /100 | #321 | Tragic 95.7% |
| Immigrants | Nicaragua | 0.0 /100 | #322 | Tragic 95.6% |
| Immigrants | Fiji | 0.0 /100 | #323 | Tragic 95.6% |
| Hondurans | 0.0 /100 | #324 | Tragic 95.6% |
| Hispanics or Latinos | 0.0 /100 | #325 | Tragic 95.6% |
| Immigrants | Cambodia | 0.0 /100 | #326 | Tragic 95.5% |
| Dominicans | 0.0 /100 | #327 | Tragic 95.5% |
| Cape Verdeans | 0.0 /100 | #328 | Tragic 95.5% |
| Mexican American Indians | 0.0 /100 | #329 | Tragic 95.5% |
| Immigrants | Armenia | 0.0 /100 | #330 | Tragic 95.4% |
| Immigrants | Honduras | 0.0 /100 | #331 | Tragic 95.4% |
| Immigrants | Dominican Republic | 0.0 /100 | #332 | Tragic 95.3% |
| Immigrants | Latin America | 0.0 /100 | #333 | Tragic 95.3% |
| Nepalese | 0.0 /100 | #334 | Tragic 95.2% |