Sierra Leonean vs Luxembourger Nursery School
COMPARE
Sierra Leonean
Luxembourger
Nursery School
Nursery School Comparison
Sierra Leoneans
Luxembourgers
97.7%
NURSERY SCHOOL
2.9/ 100
METRIC RATING
230th/ 347
METRIC RANK
98.5%
NURSERY SCHOOL
99.9/ 100
METRIC RATING
41st/ 347
METRIC RANK
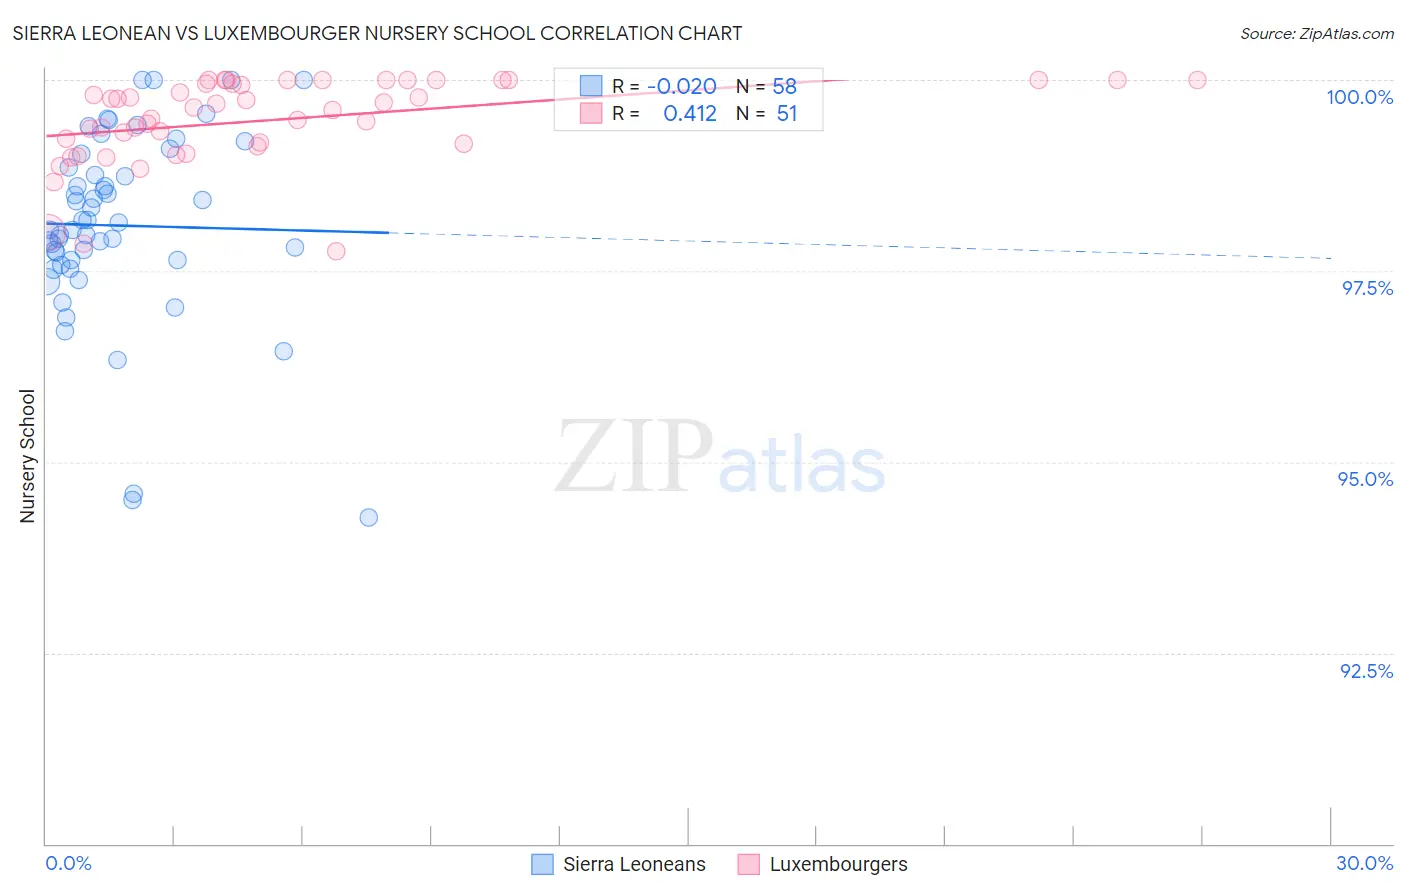
Sierra Leonean vs Luxembourger Nursery School Correlation Chart
The statistical analysis conducted on geographies consisting of 83,337,655 people shows no correlation between the proportion of Sierra Leoneans and percentage of population with at least nursery school education in the United States with a correlation coefficient (R) of -0.020 and weighted average of 97.7%. Similarly, the statistical analysis conducted on geographies consisting of 144,675,804 people shows a moderate positive correlation between the proportion of Luxembourgers and percentage of population with at least nursery school education in the United States with a correlation coefficient (R) of 0.412 and weighted average of 98.5%, a difference of 0.81%.
Nursery School Correlation Summary
| Measurement | Sierra Leonean | Luxembourger |
| Minimum | 94.3% | 97.8% |
| Maximum | 100.0% | 100.0% |
| Range | 5.7% | 2.2% |
| Mean | 98.1% | 99.5% |
| Median | 98.1% | 99.6% |
| Interquartile 25% (IQ1) | 97.6% | 99.2% |
| Interquartile 75% (IQ3) | 98.9% | 100.0% |
| Interquartile Range (IQR) | 1.2% | 0.83% |
| Standard Deviation (Sample) | 1.2% | 0.56% |
| Standard Deviation (Population) | 1.2% | 0.56% |
Similar Demographics by Nursery School
Demographics Similar to Sierra Leoneans by Nursery School
In terms of nursery school, the demographic groups most similar to Sierra Leoneans are Immigrants from Costa Rica (97.7%, a difference of 0.010%), Iraqi (97.7%, a difference of 0.010%), Subsaharan African (97.7%, a difference of 0.010%), Sudanese (97.7%, a difference of 0.010%), and Senegalese (97.7%, a difference of 0.010%).
| Demographics | Rating | Rank | Nursery School |
| Immigrants | Sudan | 3.9 /100 | #223 | Tragic 97.7% |
| Immigrants | Nepal | 3.6 /100 | #224 | Tragic 97.7% |
| Immigrants | Costa Rica | 3.5 /100 | #225 | Tragic 97.7% |
| Iraqis | 3.5 /100 | #226 | Tragic 97.7% |
| Sub-Saharan Africans | 3.2 /100 | #227 | Tragic 97.7% |
| Sudanese | 3.2 /100 | #228 | Tragic 97.7% |
| Senegalese | 3.2 /100 | #229 | Tragic 97.7% |
| Sierra Leoneans | 2.9 /100 | #230 | Tragic 97.7% |
| Puerto Ricans | 2.6 /100 | #231 | Tragic 97.7% |
| Immigrants | Uruguay | 2.3 /100 | #232 | Tragic 97.7% |
| U.S. Virgin Islanders | 2.1 /100 | #233 | Tragic 97.7% |
| Colombians | 2.1 /100 | #234 | Tragic 97.7% |
| Immigrants | Pakistan | 2.1 /100 | #235 | Tragic 97.7% |
| Immigrants | Malaysia | 1.9 /100 | #236 | Tragic 97.7% |
| Immigrants | Western Asia | 1.9 /100 | #237 | Tragic 97.7% |
Demographics Similar to Luxembourgers by Nursery School
In terms of nursery school, the demographic groups most similar to Luxembourgers are Eastern European (98.5%, a difference of 0.0%), Latvian (98.5%, a difference of 0.010%), Chippewa (98.5%, a difference of 0.010%), Native Hawaiian (98.5%, a difference of 0.010%), and Belgian (98.5%, a difference of 0.010%).
| Demographics | Rating | Rank | Nursery School |
| Chinese | 100.0 /100 | #34 | Exceptional 98.6% |
| Swiss | 100.0 /100 | #35 | Exceptional 98.6% |
| British | 100.0 /100 | #36 | Exceptional 98.5% |
| Lumbee | 99.9 /100 | #37 | Exceptional 98.5% |
| Italians | 99.9 /100 | #38 | Exceptional 98.5% |
| Latvians | 99.9 /100 | #39 | Exceptional 98.5% |
| Chippewa | 99.9 /100 | #40 | Exceptional 98.5% |
| Luxembourgers | 99.9 /100 | #41 | Exceptional 98.5% |
| Eastern Europeans | 99.9 /100 | #42 | Exceptional 98.5% |
| Native Hawaiians | 99.9 /100 | #43 | Exceptional 98.5% |
| Belgians | 99.9 /100 | #44 | Exceptional 98.5% |
| Northern Europeans | 99.9 /100 | #45 | Exceptional 98.5% |
| Hungarians | 99.9 /100 | #46 | Exceptional 98.5% |
| Czechoslovakians | 99.9 /100 | #47 | Exceptional 98.5% |
| Ottawa | 99.8 /100 | #48 | Exceptional 98.5% |