Apache vs Immigrants from Egypt 6th Grade
COMPARE
Apache
Immigrants from Egypt
6th Grade
6th Grade Comparison
Apache
Immigrants from Egypt
97.1%
6TH GRADE
53.6/ 100
METRIC RATING
167th/ 347
METRIC RANK
97.0%
6TH GRADE
31.4/ 100
METRIC RATING
186th/ 347
METRIC RANK
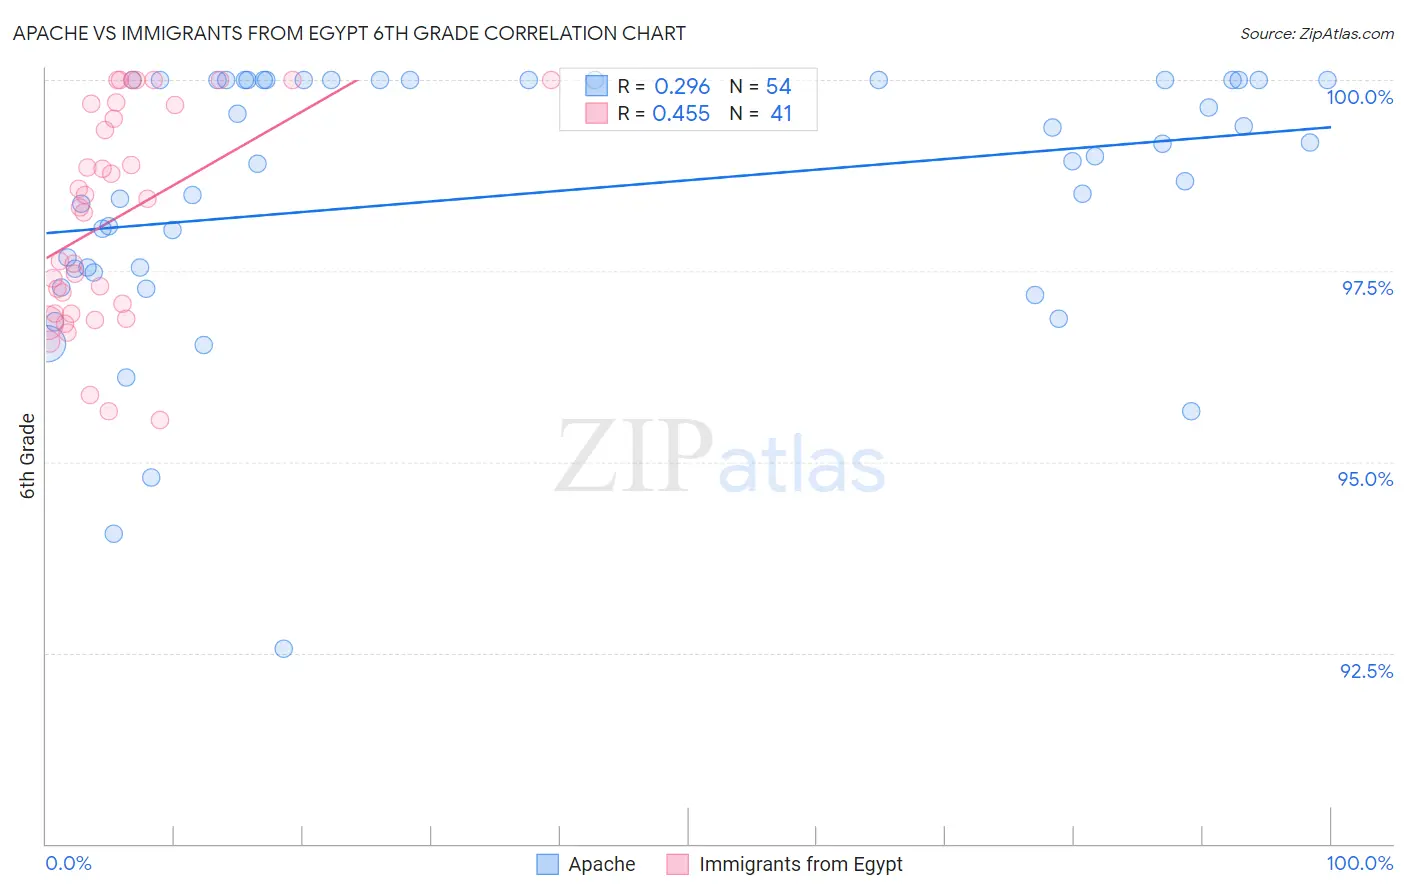
Apache vs Immigrants from Egypt 6th Grade Correlation Chart
The statistical analysis conducted on geographies consisting of 231,142,814 people shows a weak positive correlation between the proportion of Apache and percentage of population with at least 6th grade education in the United States with a correlation coefficient (R) of 0.296 and weighted average of 97.1%. Similarly, the statistical analysis conducted on geographies consisting of 245,485,794 people shows a moderate positive correlation between the proportion of Immigrants from Egypt and percentage of population with at least 6th grade education in the United States with a correlation coefficient (R) of 0.455 and weighted average of 97.0%, a difference of 0.11%.
6th Grade Correlation Summary
| Measurement | Apache | Immigrants from Egypt |
| Minimum | 92.5% | 95.5% |
| Maximum | 100.0% | 100.0% |
| Range | 7.5% | 4.5% |
| Mean | 98.5% | 98.2% |
| Median | 99.0% | 98.3% |
| Interquartile 25% (IQ1) | 97.5% | 96.9% |
| Interquartile 75% (IQ3) | 100.0% | 99.7% |
| Interquartile Range (IQR) | 2.5% | 2.7% |
| Standard Deviation (Sample) | 1.7% | 1.4% |
| Standard Deviation (Population) | 1.7% | 1.4% |
Demographics Similar to Apache and Immigrants from Egypt by 6th Grade
In terms of 6th grade, the demographic groups most similar to Apache are Immigrants from Italy (97.1%, a difference of 0.0%), Immigrants from Taiwan (97.1%, a difference of 0.0%), Bermudan (97.1%, a difference of 0.0%), Chilean (97.1%, a difference of 0.010%), and Immigrants from Sri Lanka (97.1%, a difference of 0.010%). Similarly, the demographic groups most similar to Immigrants from Egypt are Spanish American (97.0%, a difference of 0.010%), Argentinean (97.0%, a difference of 0.010%), Immigrants from Ukraine (97.0%, a difference of 0.020%), Immigrants from Venezuela (97.0%, a difference of 0.020%), and Comanche (97.0%, a difference of 0.030%).
| Demographics | Rating | Rank | 6th Grade |
| Immigrants | Italy | 53.8 /100 | #166 | Average 97.1% |
| Apache | 53.6 /100 | #167 | Average 97.1% |
| Immigrants | Taiwan | 53.5 /100 | #168 | Average 97.1% |
| Bermudans | 52.6 /100 | #169 | Average 97.1% |
| Chileans | 52.1 /100 | #170 | Average 97.1% |
| Immigrants | Sri Lanka | 51.7 /100 | #171 | Average 97.1% |
| Egyptians | 50.9 /100 | #172 | Average 97.1% |
| Arabs | 50.1 /100 | #173 | Average 97.0% |
| Venezuelans | 50.0 /100 | #174 | Average 97.0% |
| Immigrants | Kazakhstan | 47.3 /100 | #175 | Average 97.0% |
| Immigrants | Micronesia | 47.1 /100 | #176 | Average 97.0% |
| Mongolians | 46.7 /100 | #177 | Average 97.0% |
| Pakistanis | 46.0 /100 | #178 | Average 97.0% |
| Immigrants | Kenya | 45.3 /100 | #179 | Average 97.0% |
| Immigrants | Spain | 39.9 /100 | #180 | Fair 97.0% |
| Comanche | 37.9 /100 | #181 | Fair 97.0% |
| Immigrants | Ukraine | 35.6 /100 | #182 | Fair 97.0% |
| Immigrants | Venezuela | 34.5 /100 | #183 | Fair 97.0% |
| Spanish Americans | 33.5 /100 | #184 | Fair 97.0% |
| Argentineans | 33.0 /100 | #185 | Fair 97.0% |
| Immigrants | Egypt | 31.4 /100 | #186 | Fair 97.0% |