Alsatian vs Malaysian Unemployment Among Women with Children Ages 6 to 17 years
COMPARE
Alsatian
Malaysian
Unemployment Among Women with Children Ages 6 to 17 years
Unemployment Among Women with Children Ages 6 to 17 years Comparison
Alsatians
Malaysians
8.0%
UNEMPLOYMENT AMONG WOMEN WITH CHILDREN AGES 6 TO 17 YEARS
100.0/ 100
METRIC RATING
38th/ 347
METRIC RANK
8.6%
UNEMPLOYMENT AMONG WOMEN WITH CHILDREN AGES 6 TO 17 YEARS
98.5/ 100
METRIC RATING
98th/ 347
METRIC RANK
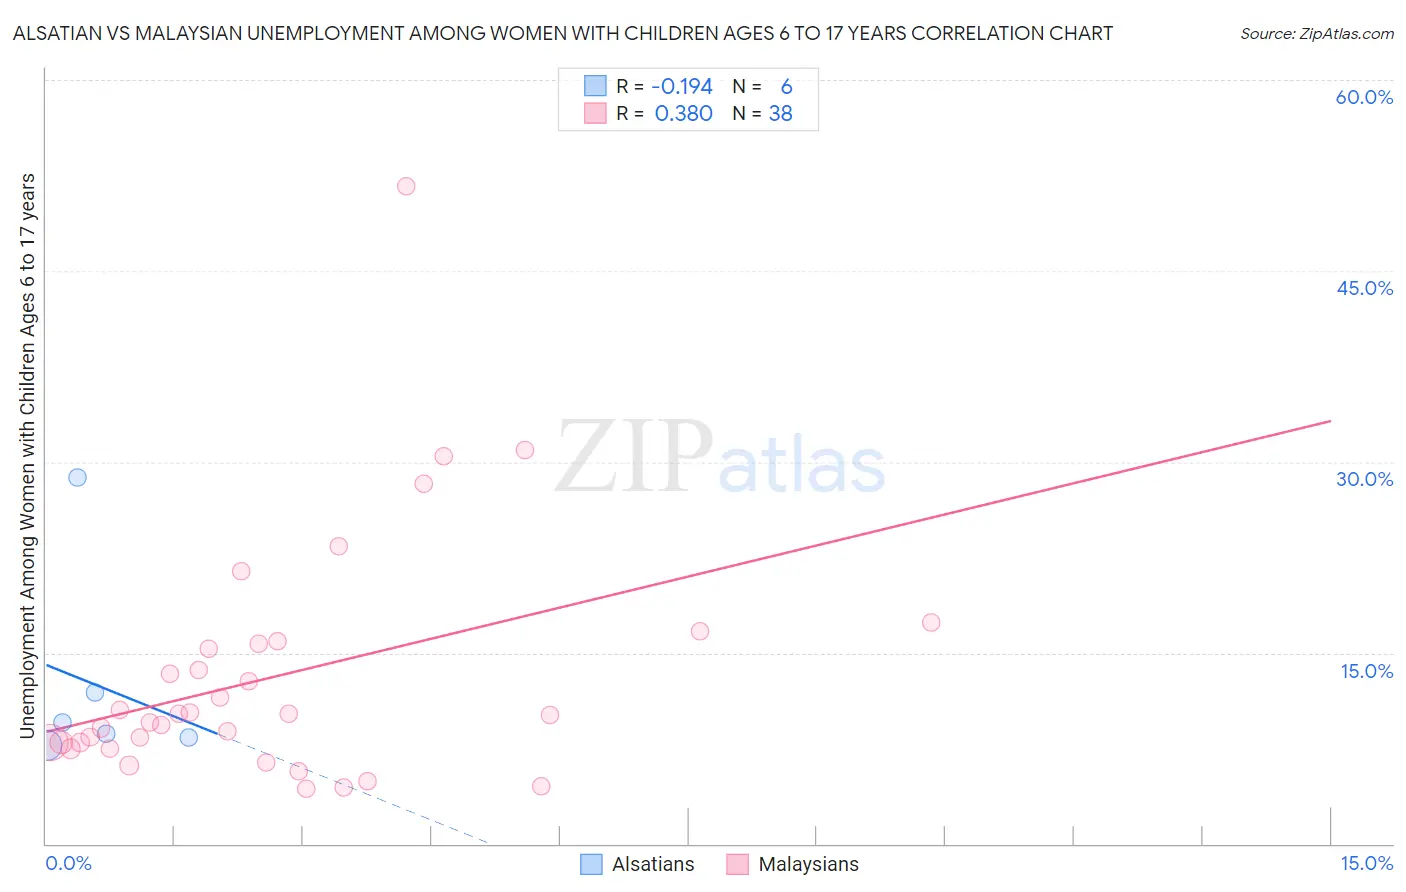
Alsatian vs Malaysian Unemployment Among Women with Children Ages 6 to 17 years Correlation Chart
The statistical analysis conducted on geographies consisting of 72,025,993 people shows a poor negative correlation between the proportion of Alsatians and unemployment rate among women with children between the ages 6 and 17 in the United States with a correlation coefficient (R) of -0.194 and weighted average of 8.0%. Similarly, the statistical analysis conducted on geographies consisting of 183,276,998 people shows a mild positive correlation between the proportion of Malaysians and unemployment rate among women with children between the ages 6 and 17 in the United States with a correlation coefficient (R) of 0.380 and weighted average of 8.6%, a difference of 7.1%.
Unemployment Among Women with Children Ages 6 to 17 years Correlation Summary
| Measurement | Alsatian | Malaysian |
| Minimum | 7.7% | 4.4% |
| Maximum | 28.8% | 51.7% |
| Range | 21.1% | 47.3% |
| Mean | 12.5% | 13.1% |
| Median | 9.1% | 10.1% |
| Interquartile 25% (IQ1) | 8.3% | 7.9% |
| Interquartile 75% (IQ3) | 11.9% | 15.7% |
| Interquartile Range (IQR) | 3.6% | 7.8% |
| Standard Deviation (Sample) | 8.1% | 9.4% |
| Standard Deviation (Population) | 7.4% | 9.3% |
Similar Demographics by Unemployment Among Women with Children Ages 6 to 17 years
Demographics Similar to Alsatians by Unemployment Among Women with Children Ages 6 to 17 years
In terms of unemployment among women with children ages 6 to 17 years, the demographic groups most similar to Alsatians are Somali (8.0%, a difference of 0.14%), Asian (8.0%, a difference of 0.33%), Burmese (8.0%, a difference of 0.36%), Immigrants from Zimbabwe (8.0%, a difference of 0.43%), and Immigrants from South Central Asia (7.9%, a difference of 0.44%).
| Demographics | Rating | Rank | Unemployment Among Women with Children Ages 6 to 17 years |
| Laotians | 100.0 /100 | #31 | Exceptional 7.9% |
| Immigrants | Cambodia | 100.0 /100 | #32 | Exceptional 7.9% |
| Immigrants | Korea | 100.0 /100 | #33 | Exceptional 7.9% |
| Native Hawaiians | 100.0 /100 | #34 | Exceptional 7.9% |
| Immigrants | South Central Asia | 100.0 /100 | #35 | Exceptional 7.9% |
| Burmese | 100.0 /100 | #36 | Exceptional 8.0% |
| Asians | 100.0 /100 | #37 | Exceptional 8.0% |
| Alsatians | 100.0 /100 | #38 | Exceptional 8.0% |
| Somalis | 100.0 /100 | #39 | Exceptional 8.0% |
| Immigrants | Zimbabwe | 100.0 /100 | #40 | Exceptional 8.0% |
| Iranians | 100.0 /100 | #41 | Exceptional 8.0% |
| Immigrants | Somalia | 100.0 /100 | #42 | Exceptional 8.0% |
| Bhutanese | 100.0 /100 | #43 | Exceptional 8.1% |
| Immigrants | Sweden | 100.0 /100 | #44 | Exceptional 8.1% |
| Immigrants | Bulgaria | 100.0 /100 | #45 | Exceptional 8.1% |
Demographics Similar to Malaysians by Unemployment Among Women with Children Ages 6 to 17 years
In terms of unemployment among women with children ages 6 to 17 years, the demographic groups most similar to Malaysians are Bolivian (8.5%, a difference of 0.040%), Immigrants from Lithuania (8.6%, a difference of 0.080%), New Zealander (8.6%, a difference of 0.080%), Immigrants from Pakistan (8.6%, a difference of 0.080%), and Immigrants from South Africa (8.6%, a difference of 0.10%).
| Demographics | Rating | Rank | Unemployment Among Women with Children Ages 6 to 17 years |
| Immigrants | Eastern Europe | 99.0 /100 | #91 | Exceptional 8.5% |
| Potawatomi | 99.0 /100 | #92 | Exceptional 8.5% |
| Australians | 98.9 /100 | #93 | Exceptional 8.5% |
| Immigrants | Barbados | 98.8 /100 | #94 | Exceptional 8.5% |
| Sri Lankans | 98.7 /100 | #95 | Exceptional 8.5% |
| German Russians | 98.6 /100 | #96 | Exceptional 8.5% |
| Bolivians | 98.5 /100 | #97 | Exceptional 8.5% |
| Malaysians | 98.5 /100 | #98 | Exceptional 8.6% |
| Immigrants | Lithuania | 98.4 /100 | #99 | Exceptional 8.6% |
| New Zealanders | 98.4 /100 | #100 | Exceptional 8.6% |
| Immigrants | Pakistan | 98.4 /100 | #101 | Exceptional 8.6% |
| Immigrants | South Africa | 98.3 /100 | #102 | Exceptional 8.6% |
| Scandinavians | 98.3 /100 | #103 | Exceptional 8.6% |
| Immigrants | France | 98.0 /100 | #104 | Exceptional 8.6% |
| Immigrants | Norway | 97.8 /100 | #105 | Exceptional 8.6% |