Immigrants from Zaire vs Immigrants from Bolivia Doctorate Degree
COMPARE
Immigrants from Zaire
Immigrants from Bolivia
Doctorate Degree
Doctorate Degree Comparison
Immigrants from Zaire
Immigrants from Bolivia
2.0%
DOCTORATE DEGREE
91.1/ 100
METRIC RATING
128th/ 347
METRIC RANK
2.3%
DOCTORATE DEGREE
99.8/ 100
METRIC RATING
71st/ 347
METRIC RANK
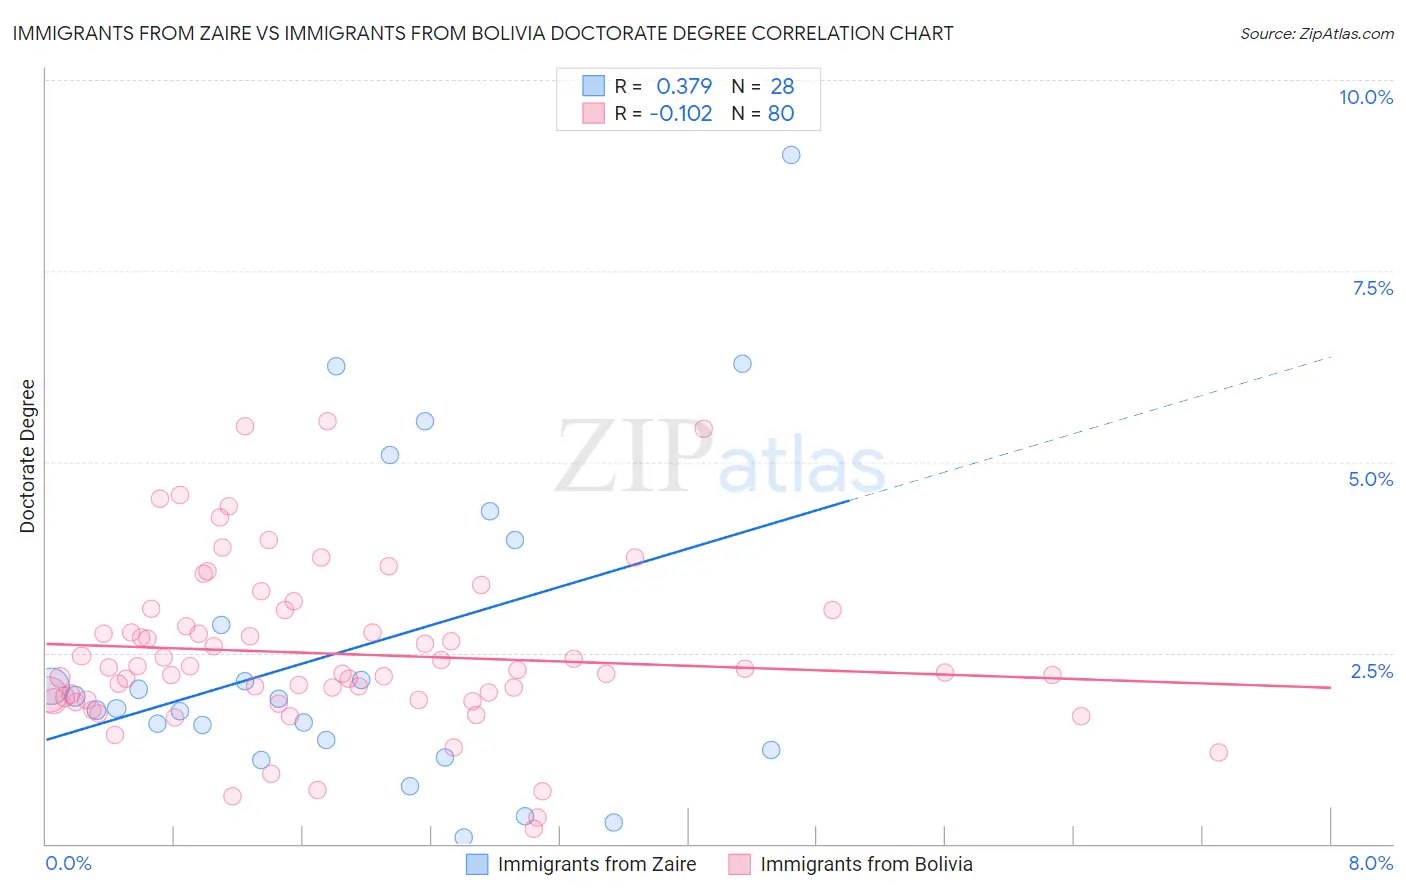
Immigrants from Zaire vs Immigrants from Bolivia Doctorate Degree Correlation Chart
The statistical analysis conducted on geographies consisting of 107,152,130 people shows a mild positive correlation between the proportion of Immigrants from Zaire and percentage of population with at least doctorate degree education in the United States with a correlation coefficient (R) of 0.379 and weighted average of 2.0%. Similarly, the statistical analysis conducted on geographies consisting of 158,321,845 people shows a poor negative correlation between the proportion of Immigrants from Bolivia and percentage of population with at least doctorate degree education in the United States with a correlation coefficient (R) of -0.102 and weighted average of 2.3%, a difference of 13.2%.
Doctorate Degree Correlation Summary
| Measurement | Immigrants from Zaire | Immigrants from Bolivia |
| Minimum | 0.076% | 0.19% |
| Maximum | 9.0% | 5.5% |
| Range | 8.9% | 5.3% |
| Mean | 2.6% | 2.5% |
| Median | 1.8% | 2.3% |
| Interquartile 25% (IQ1) | 1.3% | 1.9% |
| Interquartile 75% (IQ3) | 3.4% | 3.0% |
| Interquartile Range (IQR) | 2.1% | 1.1% |
| Standard Deviation (Sample) | 2.1% | 1.1% |
| Standard Deviation (Population) | 2.1% | 1.1% |
Similar Demographics by Doctorate Degree
Demographics Similar to Immigrants from Zaire by Doctorate Degree
In terms of doctorate degree, the demographic groups most similar to Immigrants from Zaire are Canadian (2.0%, a difference of 0.22%), Immigrants from Ukraine (2.0%, a difference of 0.22%), Immigrants from Sierra Leone (2.0%, a difference of 0.36%), Palestinian (2.0%, a difference of 0.42%), and Jordanian (2.0%, a difference of 0.46%).
| Demographics | Rating | Rank | Doctorate Degree |
| Immigrants | Jordan | 94.8 /100 | #121 | Exceptional 2.0% |
| Immigrants | Southern Europe | 94.7 /100 | #122 | Exceptional 2.0% |
| Croatians | 94.0 /100 | #123 | Exceptional 2.0% |
| Ute | 93.2 /100 | #124 | Exceptional 2.0% |
| Moroccans | 93.0 /100 | #125 | Exceptional 2.0% |
| Jordanians | 92.1 /100 | #126 | Exceptional 2.0% |
| Palestinians | 92.0 /100 | #127 | Exceptional 2.0% |
| Immigrants | Zaire | 91.1 /100 | #128 | Exceptional 2.0% |
| Canadians | 90.6 /100 | #129 | Exceptional 2.0% |
| Immigrants | Ukraine | 90.5 /100 | #130 | Exceptional 2.0% |
| Immigrants | Sierra Leone | 90.2 /100 | #131 | Exceptional 2.0% |
| Scottish | 89.4 /100 | #132 | Excellent 2.0% |
| Immigrants | Uzbekistan | 89.3 /100 | #133 | Excellent 2.0% |
| Immigrants | Cameroon | 88.9 /100 | #134 | Excellent 2.0% |
| Serbians | 88.7 /100 | #135 | Excellent 2.0% |
Demographics Similar to Immigrants from Bolivia by Doctorate Degree
In terms of doctorate degree, the demographic groups most similar to Immigrants from Bolivia are Lithuanian (2.3%, a difference of 0.0%), Carpatho Rusyn (2.3%, a difference of 0.14%), Immigrants from Canada (2.3%, a difference of 0.16%), Immigrants from Bulgaria (2.3%, a difference of 0.24%), and Immigrants from North America (2.2%, a difference of 0.38%).
| Demographics | Rating | Rank | Doctorate Degree |
| Immigrants | Greece | 99.9 /100 | #64 | Exceptional 2.3% |
| Paraguayans | 99.9 /100 | #65 | Exceptional 2.3% |
| Argentineans | 99.9 /100 | #66 | Exceptional 2.3% |
| Zimbabweans | 99.8 /100 | #67 | Exceptional 2.3% |
| Immigrants | Kazakhstan | 99.8 /100 | #68 | Exceptional 2.3% |
| Carpatho Rusyns | 99.8 /100 | #69 | Exceptional 2.3% |
| Lithuanians | 99.8 /100 | #70 | Exceptional 2.3% |
| Immigrants | Bolivia | 99.8 /100 | #71 | Exceptional 2.3% |
| Immigrants | Canada | 99.8 /100 | #72 | Exceptional 2.3% |
| Immigrants | Bulgaria | 99.8 /100 | #73 | Exceptional 2.3% |
| Immigrants | North America | 99.8 /100 | #74 | Exceptional 2.2% |
| Immigrants | Western Asia | 99.8 /100 | #75 | Exceptional 2.2% |
| Immigrants | Hungary | 99.8 /100 | #76 | Exceptional 2.2% |
| Immigrants | Lebanon | 99.8 /100 | #77 | Exceptional 2.2% |
| Immigrants | Belarus | 99.7 /100 | #78 | Exceptional 2.2% |