Alsatian vs Costa Rican College, Under 1 year
COMPARE
Alsatian
Costa Rican
College, Under 1 year
College, Under 1 year Comparison
Alsatians
Costa Ricans
67.1%
COLLEGE, UNDER 1 YEAR
91.3/ 100
METRIC RATING
126th/ 347
METRIC RANK
64.4%
COLLEGE, UNDER 1 YEAR
19.6/ 100
METRIC RATING
197th/ 347
METRIC RANK
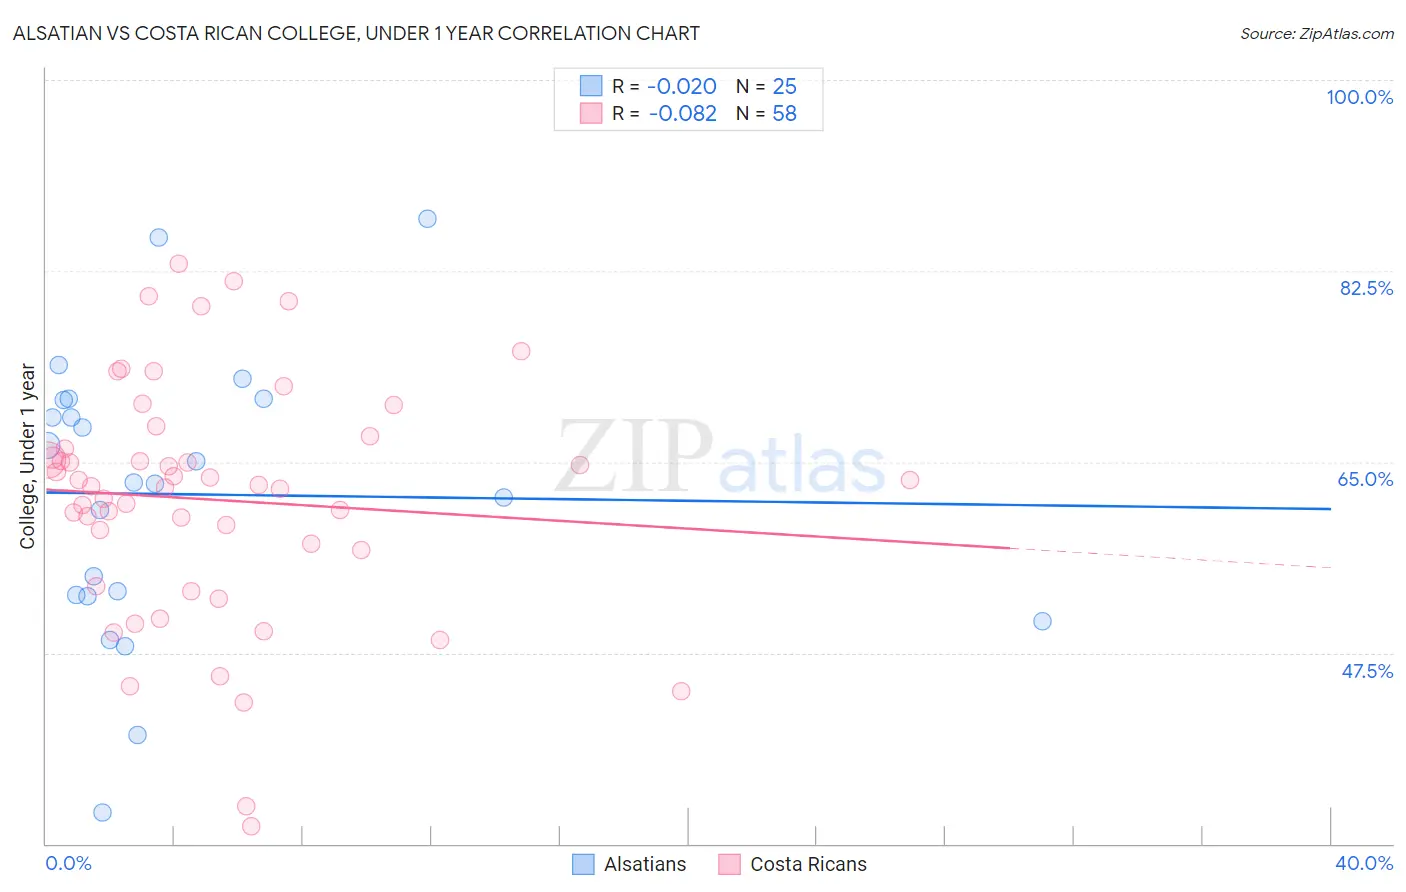
Alsatian vs Costa Rican College, Under 1 year Correlation Chart
The statistical analysis conducted on geographies consisting of 82,682,365 people shows no correlation between the proportion of Alsatians and percentage of population with at least college, under 1 year education in the United States with a correlation coefficient (R) of -0.020 and weighted average of 67.1%. Similarly, the statistical analysis conducted on geographies consisting of 253,601,310 people shows a slight negative correlation between the proportion of Costa Ricans and percentage of population with at least college, under 1 year education in the United States with a correlation coefficient (R) of -0.082 and weighted average of 64.4%, a difference of 4.2%.
College, Under 1 year Correlation Summary
| Measurement | Alsatian | Costa Rican |
| Minimum | 32.9% | 31.6% |
| Maximum | 87.3% | 83.1% |
| Range | 54.4% | 51.5% |
| Mean | 62.0% | 61.5% |
| Median | 63.1% | 62.8% |
| Interquartile 25% (IQ1) | 52.8% | 56.9% |
| Interquartile 75% (IQ3) | 70.7% | 66.2% |
| Interquartile Range (IQR) | 17.9% | 9.3% |
| Standard Deviation (Sample) | 12.9% | 10.9% |
| Standard Deviation (Population) | 12.6% | 10.8% |
Similar Demographics by College, Under 1 year
Demographics Similar to Alsatians by College, Under 1 year
In terms of college, under 1 year, the demographic groups most similar to Alsatians are Italian (67.2%, a difference of 0.060%), Czech (67.1%, a difference of 0.080%), Scottish (67.0%, a difference of 0.14%), Arab (67.2%, a difference of 0.18%), and Immigrants from Northern Africa (67.2%, a difference of 0.19%).
| Demographics | Rating | Rank | College, Under 1 year |
| Lebanese | 94.6 /100 | #119 | Exceptional 67.5% |
| Serbians | 93.9 /100 | #120 | Exceptional 67.4% |
| Slovenes | 93.3 /100 | #121 | Exceptional 67.3% |
| Immigrants | Jordan | 92.8 /100 | #122 | Exceptional 67.3% |
| Immigrants | Northern Africa | 92.7 /100 | #123 | Exceptional 67.2% |
| Arabs | 92.6 /100 | #124 | Exceptional 67.2% |
| Italians | 91.8 /100 | #125 | Exceptional 67.2% |
| Alsatians | 91.3 /100 | #126 | Exceptional 67.1% |
| Czechs | 90.8 /100 | #127 | Exceptional 67.1% |
| Scottish | 90.2 /100 | #128 | Exceptional 67.0% |
| Immigrants | Eastern Africa | 89.5 /100 | #129 | Excellent 67.0% |
| Immigrants | Syria | 89.0 /100 | #130 | Excellent 66.9% |
| Finns | 88.6 /100 | #131 | Excellent 66.9% |
| Poles | 88.4 /100 | #132 | Excellent 66.9% |
| Immigrants | Brazil | 88.3 /100 | #133 | Excellent 66.9% |
Demographics Similar to Costa Ricans by College, Under 1 year
In terms of college, under 1 year, the demographic groups most similar to Costa Ricans are Tongan (64.5%, a difference of 0.11%), Tsimshian (64.3%, a difference of 0.13%), Immigrants from South Eastern Asia (64.5%, a difference of 0.17%), Panamanian (64.3%, a difference of 0.19%), and Nigerian (64.3%, a difference of 0.22%).
| Demographics | Rating | Rank | College, Under 1 year |
| Immigrants | Philippines | 30.1 /100 | #190 | Fair 64.8% |
| Immigrants | Armenia | 28.1 /100 | #191 | Fair 64.7% |
| Immigrants | Thailand | 27.0 /100 | #192 | Fair 64.7% |
| Slovaks | 26.7 /100 | #193 | Fair 64.7% |
| Immigrants | Cameroon | 24.6 /100 | #194 | Fair 64.6% |
| Immigrants | South Eastern Asia | 22.1 /100 | #195 | Fair 64.5% |
| Tongans | 21.2 /100 | #196 | Fair 64.5% |
| Costa Ricans | 19.6 /100 | #197 | Poor 64.4% |
| Tsimshian | 17.9 /100 | #198 | Poor 64.3% |
| Panamanians | 17.0 /100 | #199 | Poor 64.3% |
| Nigerians | 16.7 /100 | #200 | Poor 64.3% |
| French Canadians | 16.3 /100 | #201 | Poor 64.2% |
| South Americans | 16.2 /100 | #202 | Poor 64.2% |
| Uruguayans | 15.6 /100 | #203 | Poor 64.2% |
| Immigrants | Zaire | 14.6 /100 | #204 | Poor 64.1% |