Aleut vs Nonimmigrants Nursery School
COMPARE
Aleut
Nonimmigrants
Nursery School
Nursery School Comparison
Aleuts
Nonimmigrants
98.7%
NURSERY SCHOOL
100.0/ 100
METRIC RATING
17th/ 347
METRIC RANK
98.3%
NURSERY SCHOOL
98.3/ 100
METRIC RATING
97th/ 347
METRIC RANK
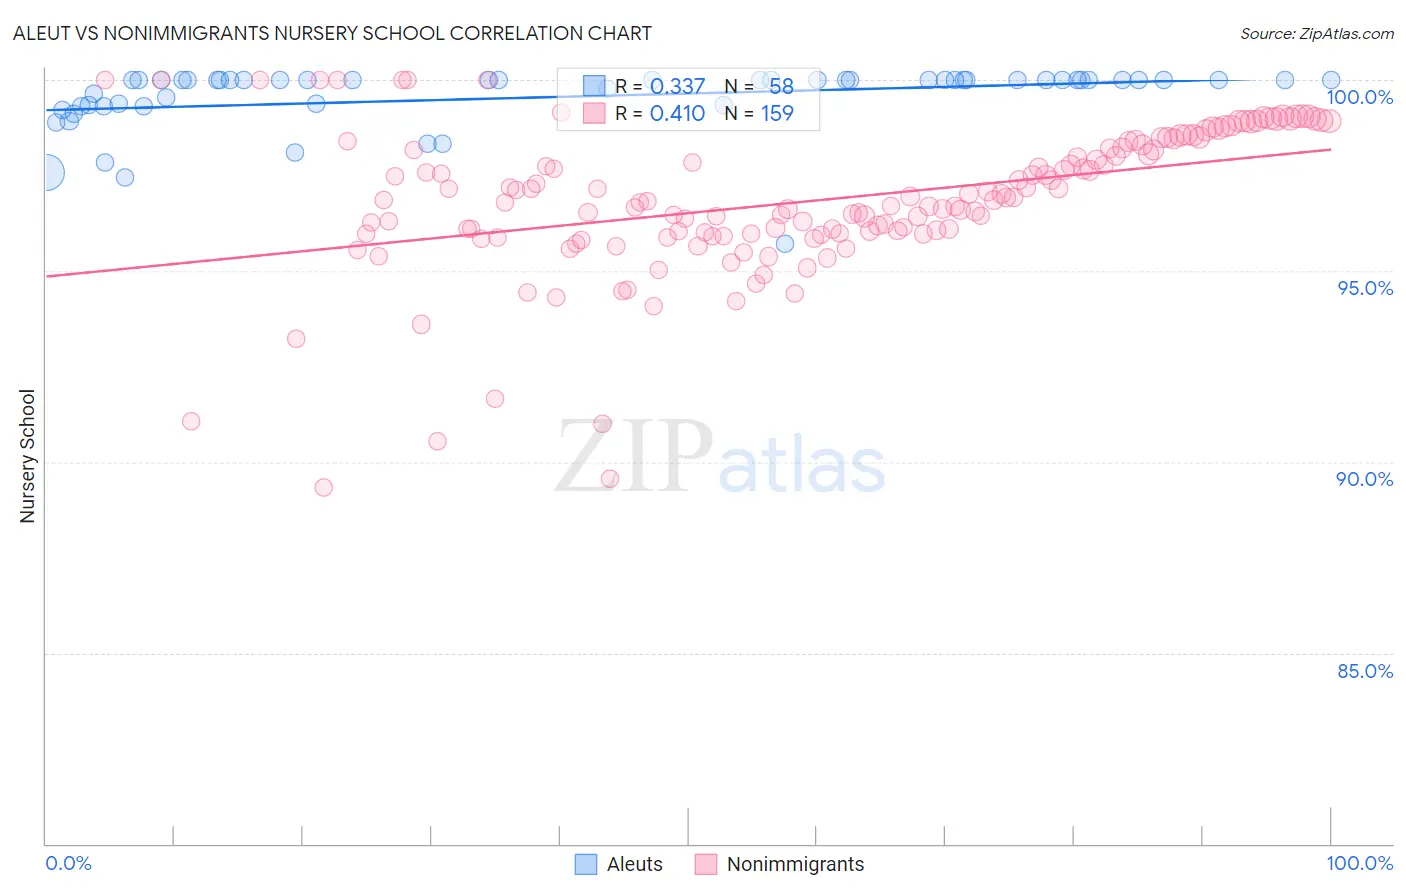
Aleut vs Nonimmigrants Nursery School Correlation Chart
The statistical analysis conducted on geographies consisting of 61,781,127 people shows a mild positive correlation between the proportion of Aleuts and percentage of population with at least nursery school education in the United States with a correlation coefficient (R) of 0.337 and weighted average of 98.7%. Similarly, the statistical analysis conducted on geographies consisting of 585,374,774 people shows a moderate positive correlation between the proportion of Nonimmigrants and percentage of population with at least nursery school education in the United States with a correlation coefficient (R) of 0.410 and weighted average of 98.3%, a difference of 0.39%.
Nursery School Correlation Summary
| Measurement | Aleut | Nonimmigrants |
| Minimum | 95.7% | 89.3% |
| Maximum | 100.0% | 100.0% |
| Range | 4.3% | 10.7% |
| Mean | 99.6% | 96.8% |
| Median | 100.0% | 96.8% |
| Interquartile 25% (IQ1) | 99.3% | 96.0% |
| Interquartile 75% (IQ3) | 100.0% | 98.3% |
| Interquartile Range (IQR) | 0.65% | 2.3% |
| Standard Deviation (Sample) | 0.84% | 1.9% |
| Standard Deviation (Population) | 0.83% | 1.9% |
Similar Demographics by Nursery School
Demographics Similar to Aleuts by Nursery School
In terms of nursery school, the demographic groups most similar to Aleuts are Scottish (98.7%, a difference of 0.0%), Dutch (98.7%, a difference of 0.0%), Swedish (98.7%, a difference of 0.020%), Irish (98.6%, a difference of 0.020%), and English (98.7%, a difference of 0.030%).
| Demographics | Rating | Rank | Nursery School |
| Germans | 100.0 /100 | #10 | Exceptional 98.7% |
| Tlingit-Haida | 100.0 /100 | #11 | Exceptional 98.7% |
| Slovenes | 100.0 /100 | #12 | Exceptional 98.7% |
| English | 100.0 /100 | #13 | Exceptional 98.7% |
| Carpatho Rusyns | 100.0 /100 | #14 | Exceptional 98.7% |
| Swedes | 100.0 /100 | #15 | Exceptional 98.7% |
| Scottish | 100.0 /100 | #16 | Exceptional 98.7% |
| Aleuts | 100.0 /100 | #17 | Exceptional 98.7% |
| Dutch | 100.0 /100 | #18 | Exceptional 98.7% |
| Irish | 100.0 /100 | #19 | Exceptional 98.6% |
| Pennsylvania Germans | 100.0 /100 | #20 | Exceptional 98.6% |
| Finns | 100.0 /100 | #21 | Exceptional 98.6% |
| Lithuanians | 100.0 /100 | #22 | Exceptional 98.6% |
| Poles | 100.0 /100 | #23 | Exceptional 98.6% |
| Danes | 100.0 /100 | #24 | Exceptional 98.6% |
Demographics Similar to Nonimmigrants by Nursery School
In terms of nursery school, the demographic groups most similar to Nonimmigrants are Cypriot (98.3%, a difference of 0.0%), Choctaw (98.3%, a difference of 0.0%), Immigrants from Germany (98.3%, a difference of 0.010%), South African (98.3%, a difference of 0.010%), and Colville (98.3%, a difference of 0.010%).
| Demographics | Rating | Rank | Nursery School |
| Immigrants | Western Europe | 98.8 /100 | #90 | Exceptional 98.3% |
| Zimbabweans | 98.8 /100 | #91 | Exceptional 98.3% |
| Macedonians | 98.7 /100 | #92 | Exceptional 98.3% |
| Immigrants | India | 98.7 /100 | #93 | Exceptional 98.3% |
| Immigrants | Germany | 98.6 /100 | #94 | Exceptional 98.3% |
| South Africans | 98.6 /100 | #95 | Exceptional 98.3% |
| Cypriots | 98.3 /100 | #96 | Exceptional 98.3% |
| Immigrants | Nonimmigrants | 98.3 /100 | #97 | Exceptional 98.3% |
| Choctaw | 98.3 /100 | #98 | Exceptional 98.3% |
| Colville | 98.2 /100 | #99 | Exceptional 98.3% |
| Puget Sound Salish | 98.0 /100 | #100 | Exceptional 98.3% |
| Romanians | 97.9 /100 | #101 | Exceptional 98.3% |
| Immigrants | Ireland | 97.7 /100 | #102 | Exceptional 98.3% |
| Cree | 97.7 /100 | #103 | Exceptional 98.3% |
| Bhutanese | 97.4 /100 | #104 | Exceptional 98.2% |