Aleut vs Immigrants from Laos Nursery School
COMPARE
Aleut
Immigrants from Laos
Nursery School
Nursery School Comparison
Aleuts
Immigrants from Laos
98.7%
NURSERY SCHOOL
100.0/ 100
METRIC RATING
17th/ 347
METRIC RANK
96.9%
NURSERY SCHOOL
0.0/ 100
METRIC RATING
319th/ 347
METRIC RANK
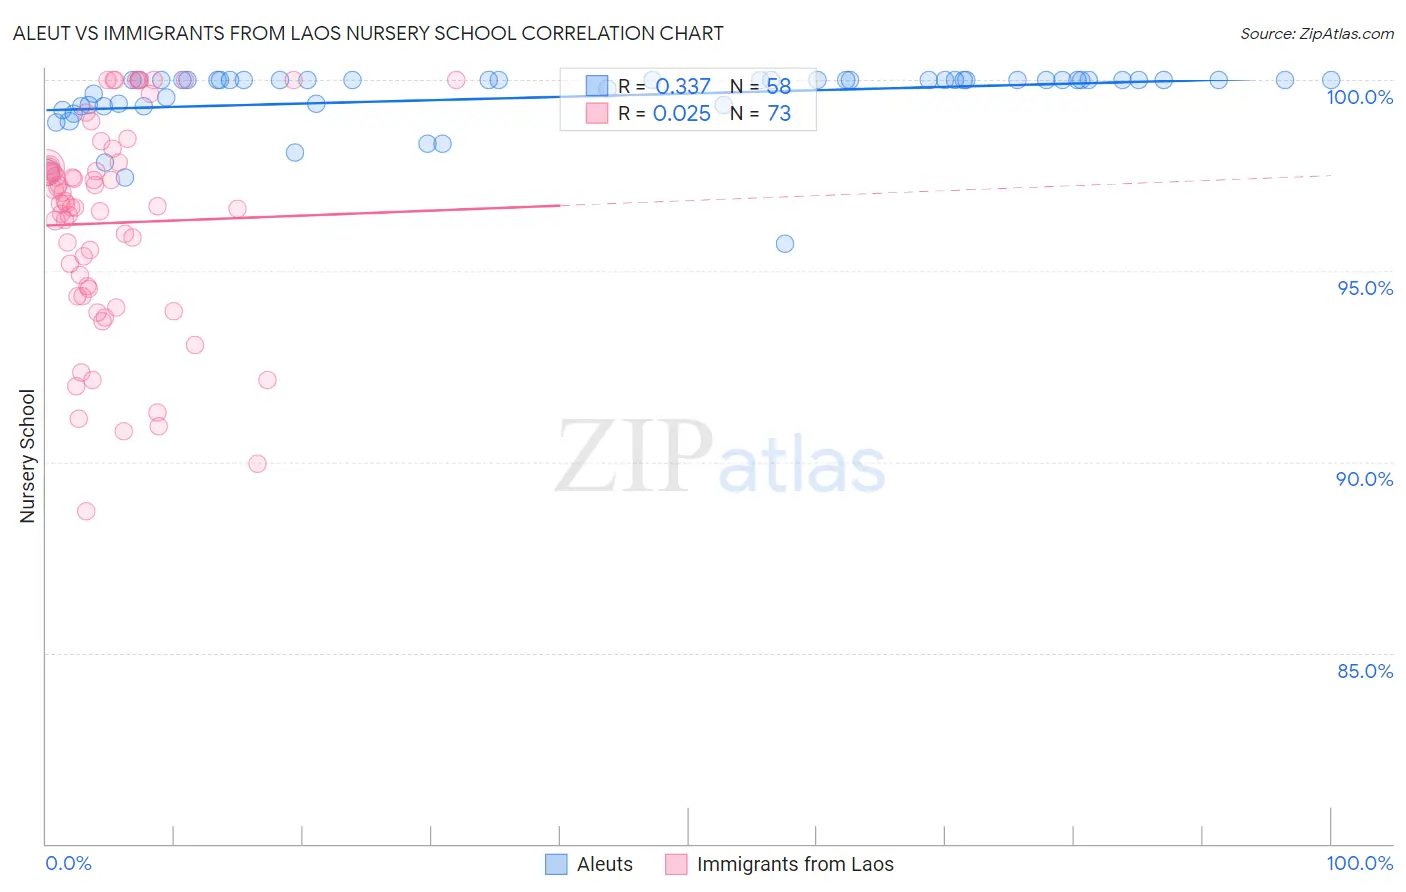
Aleut vs Immigrants from Laos Nursery School Correlation Chart
The statistical analysis conducted on geographies consisting of 61,781,127 people shows a mild positive correlation between the proportion of Aleuts and percentage of population with at least nursery school education in the United States with a correlation coefficient (R) of 0.337 and weighted average of 98.7%. Similarly, the statistical analysis conducted on geographies consisting of 201,453,273 people shows no correlation between the proportion of Immigrants from Laos and percentage of population with at least nursery school education in the United States with a correlation coefficient (R) of 0.025 and weighted average of 96.9%, a difference of 1.8%.
Nursery School Correlation Summary
| Measurement | Aleut | Immigrants from Laos |
| Minimum | 95.7% | 88.7% |
| Maximum | 100.0% | 100.0% |
| Range | 4.3% | 11.3% |
| Mean | 99.6% | 96.3% |
| Median | 100.0% | 96.8% |
| Interquartile 25% (IQ1) | 99.3% | 94.4% |
| Interquartile 75% (IQ3) | 100.0% | 97.8% |
| Interquartile Range (IQR) | 0.65% | 3.3% |
| Standard Deviation (Sample) | 0.84% | 2.7% |
| Standard Deviation (Population) | 0.83% | 2.7% |
Similar Demographics by Nursery School
Demographics Similar to Aleuts by Nursery School
In terms of nursery school, the demographic groups most similar to Aleuts are Scottish (98.7%, a difference of 0.0%), Dutch (98.7%, a difference of 0.0%), Swedish (98.7%, a difference of 0.020%), Irish (98.6%, a difference of 0.020%), and English (98.7%, a difference of 0.030%).
| Demographics | Rating | Rank | Nursery School |
| Germans | 100.0 /100 | #10 | Exceptional 98.7% |
| Tlingit-Haida | 100.0 /100 | #11 | Exceptional 98.7% |
| Slovenes | 100.0 /100 | #12 | Exceptional 98.7% |
| English | 100.0 /100 | #13 | Exceptional 98.7% |
| Carpatho Rusyns | 100.0 /100 | #14 | Exceptional 98.7% |
| Swedes | 100.0 /100 | #15 | Exceptional 98.7% |
| Scottish | 100.0 /100 | #16 | Exceptional 98.7% |
| Aleuts | 100.0 /100 | #17 | Exceptional 98.7% |
| Dutch | 100.0 /100 | #18 | Exceptional 98.7% |
| Irish | 100.0 /100 | #19 | Exceptional 98.6% |
| Pennsylvania Germans | 100.0 /100 | #20 | Exceptional 98.6% |
| Finns | 100.0 /100 | #21 | Exceptional 98.6% |
| Lithuanians | 100.0 /100 | #22 | Exceptional 98.6% |
| Poles | 100.0 /100 | #23 | Exceptional 98.6% |
| Danes | 100.0 /100 | #24 | Exceptional 98.6% |
Demographics Similar to Immigrants from Laos by Nursery School
In terms of nursery school, the demographic groups most similar to Immigrants from Laos are Immigrants from Burma/Myanmar (96.9%, a difference of 0.0%), Immigrants from Bangladesh (96.9%, a difference of 0.010%), Immigrants from Guyana (96.9%, a difference of 0.020%), Mexican American Indian (96.9%, a difference of 0.020%), and Immigrants from Honduras (96.9%, a difference of 0.030%).
| Demographics | Rating | Rank | Nursery School |
| Sri Lankans | 0.0 /100 | #312 | Tragic 97.0% |
| Hondurans | 0.0 /100 | #313 | Tragic 97.0% |
| Cape Verdeans | 0.0 /100 | #314 | Tragic 97.0% |
| Immigrants | Nicaragua | 0.0 /100 | #315 | Tragic 96.9% |
| Immigrants | Belize | 0.0 /100 | #316 | Tragic 96.9% |
| Immigrants | Ecuador | 0.0 /100 | #317 | Tragic 96.9% |
| Immigrants | Guyana | 0.0 /100 | #318 | Tragic 96.9% |
| Immigrants | Laos | 0.0 /100 | #319 | Tragic 96.9% |
| Immigrants | Burma/Myanmar | 0.0 /100 | #320 | Tragic 96.9% |
| Immigrants | Bangladesh | 0.0 /100 | #321 | Tragic 96.9% |
| Mexican American Indians | 0.0 /100 | #322 | Tragic 96.9% |
| Immigrants | Honduras | 0.0 /100 | #323 | Tragic 96.9% |
| Vietnamese | 0.0 /100 | #324 | Tragic 96.8% |
| Dominicans | 0.0 /100 | #325 | Tragic 96.8% |
| Indonesians | 0.0 /100 | #326 | Tragic 96.8% |