Immigrants from Caribbean vs Immigrants from Nicaragua 3rd Grade
COMPARE
Immigrants from Caribbean
Immigrants from Nicaragua
3rd Grade
3rd Grade Comparison
Immigrants from Caribbean
Immigrants from Nicaragua
96.7%
3RD GRADE
0.0/ 100
METRIC RATING
304th/ 347
METRIC RANK
96.5%
3RD GRADE
0.0/ 100
METRIC RATING
320th/ 347
METRIC RANK
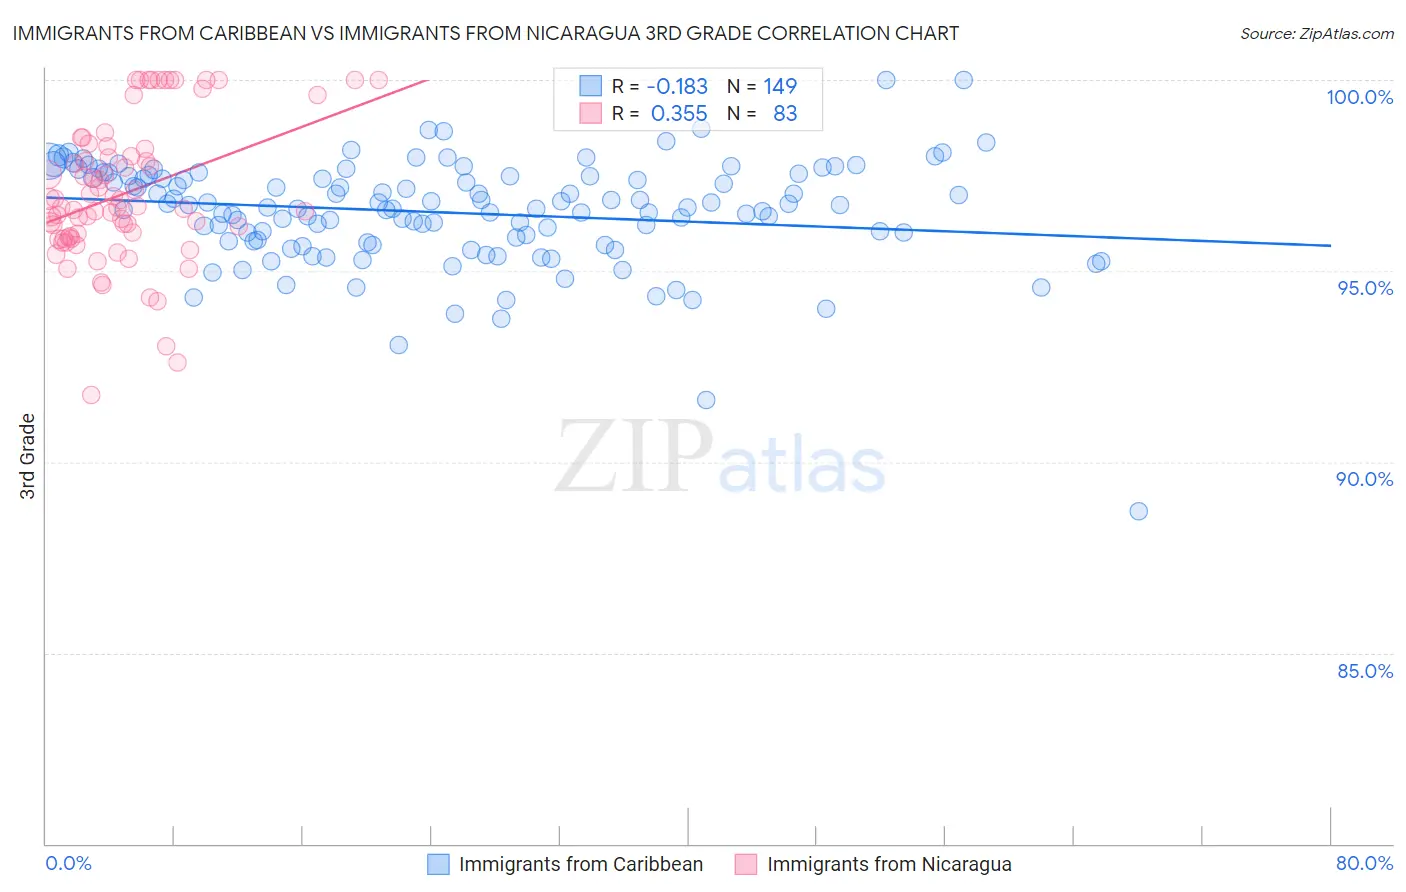
Immigrants from Caribbean vs Immigrants from Nicaragua 3rd Grade Correlation Chart
The statistical analysis conducted on geographies consisting of 450,065,262 people shows a poor negative correlation between the proportion of Immigrants from Caribbean and percentage of population with at least 3rd grade education in the United States with a correlation coefficient (R) of -0.183 and weighted average of 96.7%. Similarly, the statistical analysis conducted on geographies consisting of 236,332,861 people shows a mild positive correlation between the proportion of Immigrants from Nicaragua and percentage of population with at least 3rd grade education in the United States with a correlation coefficient (R) of 0.355 and weighted average of 96.5%, a difference of 0.24%.
3rd Grade Correlation Summary
| Measurement | Immigrants from Caribbean | Immigrants from Nicaragua |
| Minimum | 88.7% | 91.7% |
| Maximum | 100.0% | 100.0% |
| Range | 11.3% | 8.3% |
| Mean | 96.5% | 97.0% |
| Median | 96.7% | 96.7% |
| Interquartile 25% (IQ1) | 95.8% | 95.9% |
| Interquartile 75% (IQ3) | 97.5% | 98.2% |
| Interquartile Range (IQR) | 1.7% | 2.3% |
| Standard Deviation (Sample) | 1.4% | 1.8% |
| Standard Deviation (Population) | 1.4% | 1.8% |
Demographics Similar to Immigrants from Caribbean and Immigrants from Nicaragua by 3rd Grade
In terms of 3rd grade, the demographic groups most similar to Immigrants from Caribbean are Central American Indian (96.7%, a difference of 0.010%), Immigrants from Somalia (96.8%, a difference of 0.020%), Ecuadorian (96.7%, a difference of 0.020%), Guyanese (96.7%, a difference of 0.040%), and Nicaraguan (96.7%, a difference of 0.060%). Similarly, the demographic groups most similar to Immigrants from Nicaragua are Indonesian (96.5%, a difference of 0.0%), Immigrants from Belize (96.5%, a difference of 0.0%), Vietnamese (96.5%, a difference of 0.010%), Hispanic or Latino (96.5%, a difference of 0.020%), and Immigrants from Bangladesh (96.6%, a difference of 0.050%).
| Demographics | Rating | Rank | 3rd Grade |
| Immigrants | Somalia | 0.0 /100 | #302 | Tragic 96.8% |
| Ecuadorians | 0.0 /100 | #303 | Tragic 96.7% |
| Immigrants | Caribbean | 0.0 /100 | #304 | Tragic 96.7% |
| Central American Indians | 0.0 /100 | #305 | Tragic 96.7% |
| Guyanese | 0.0 /100 | #306 | Tragic 96.7% |
| Nicaraguans | 0.0 /100 | #307 | Tragic 96.7% |
| Immigrants | Haiti | 0.0 /100 | #308 | Tragic 96.7% |
| Sri Lankans | 0.0 /100 | #309 | Tragic 96.7% |
| Cape Verdeans | 0.0 /100 | #310 | Tragic 96.6% |
| Immigrants | Guyana | 0.0 /100 | #311 | Tragic 96.6% |
| Immigrants | Laos | 0.0 /100 | #312 | Tragic 96.6% |
| Immigrants | Ecuador | 0.0 /100 | #313 | Tragic 96.6% |
| Belizeans | 0.0 /100 | #314 | Tragic 96.6% |
| Immigrants | Azores | 0.0 /100 | #315 | Tragic 96.6% |
| Immigrants | Burma/Myanmar | 0.0 /100 | #316 | Tragic 96.6% |
| Immigrants | Bangladesh | 0.0 /100 | #317 | Tragic 96.6% |
| Hispanics or Latinos | 0.0 /100 | #318 | Tragic 96.5% |
| Vietnamese | 0.0 /100 | #319 | Tragic 96.5% |
| Immigrants | Nicaragua | 0.0 /100 | #320 | Tragic 96.5% |
| Indonesians | 0.0 /100 | #321 | Tragic 96.5% |
| Immigrants | Belize | 0.0 /100 | #322 | Tragic 96.5% |